Golden Gate architecture
------------------- Golden Gate----------------------------------

 -----------------Golden Gate Command-------------------------------
Basic Common Commands
Create Subdirs: Creates default directories within the Oracle GoldenGate home
directory
• FC. Edits a previously issued GGSCI command
• Help: Displays information about a GGSCI command
• History: Lists the most recent GGSCI commands issued
• Info All: Displays the status and lag for all Oracle GoldenGate online processes on a
system (Info All AllProcesses also displays tasks.)
• Obey: Runs a file containing a list of GGSCI commands
• Shell: Runs shell commands from within GGSCI
• Show: Displays the Oracle GoldenGate environment
• Versions: Displays OS and database versions
• View GGSEvt: Displays the Oracle GoldenGate event/error log
• View Report: Displays a process report for Extract or Replicat
health check
ggserr.log -- known as error log
Checkpoint :Both Extract and Replicat maintain checkpoints into the trails. Checkpoints provide persistent
processing whenever a failure occurs. Each process resumes where the last checkpoint was saved,
guaranteeing that no data is lost. One Extract can write to one or many trails. Each trail can then be
processed by one or many Replicat processes.
replicate uses checkpoints to store the current read and write position. replicate maintain checkpoint
  that provide a known position in the trail from which to start after a expected or unexpected shutdown
By default a record of these checkpoints is maintained in a trail file on disk in the oracle Golden gate directory,
Optionally, the checkpoint record can also be maintained in a checkpoint table in the target database.
DiscardFile. creates a log file to receive records that cannot be processed.
MAP. establishes the relationship between source table and the target table.

Obtaining Process Information Through GGSCI
GGSCI>
• Info {Extract | Replicat} <group> [Detail]
• Info Manager
• Info All
• Stats {Extract | Replicat} <group>
• Status {Extract | Replicat} <group>
• Status Manager
• Lag {Extract | Replicat} <group>
• Send Manager
• Send {Extract | Replicat}
• <command> ER <wildcard>
• View Report <group>: Contents of the process report
• View GGSEvt: Contents of the Oracle GoldenGate error log
• <command> ER <wildcard>: Information dependent on the <command> type:

Process Report Files: It enable to view Runtime statistics for the number of operations processed.
Every Extract, Replicat, and Manager process generates a report file at the end of each run.
The report can help you diagnose problems that
occurred during the run, such as invalid mapping syntax,SQL errors, and connection
errors.
To view the report, you can use the following within GGSCI:

GGSCI> View Report  groupname

Configure the Manager to purge used trail data (best practice).
Replicat can purge the data by using the MinKeepDays parameter.
TranData: Enables supplemental logging of primary keys and/or indexes for a schema or
table in the transaction logs.
Also, use SchemaTranData for all the present and future tables in a schema.

Creates an object or enables TranData or SchemaTranData capture
ASSUMETARGETDEFS : If the source table structure was identical to the target table structure, the
ASSUMETARGETDEFS keyword was used on the apply side to instruct the Replicat
process to take the first value from the trail record and write it to the first field of the
target table, the second value to the second field, etc.
DEFGEN utility : If source and target tables had a different structure, the DEFGEN utility was used to store
the static column mappings, and the SOURCEDEFS parameter was used by the Replicat
to point to the file generated by DEFGEN.
The drawback of using the DEFGEN utility
was the increased volume of manual work: whenever the source table
structure changes,The DEF file had to be regenerated to avoid losing data consistency.

Metadata in Trail Files

In recent releases, GoldenGate automatically transfers metadata definitions in trail files.
•Metadata definitions are also re-transferred in case of table structure changes.
– Definitions will only be re-transferred after DML on the table.
– Definitions will also be re-transferred after a switch to a new trail file.
Oracle GoldenGate introduces two special new record types to support metadata
encapsulation:
•Database Definition Record (DDR)
– It carries information about the database, such as vendor, character set id, locale,
and time zone.
•Table Definition Record (TDR)
It carries information about the table, such as table name, record length, number of
columns, and column names.
Enabling Supplemental Logging : Adding supplemental log data forces the log writer
to also include the primary keys to logs instead of just the columns that have changed.
Architecture of golden Gate

Manager:
• The Manager is the Oracle GoldenGate parent process.
• The Manager controls other Oracle GoldenGate processes, resources, user interface,
   and reporting of thresholds and errors.
Sample Manager Parameter File
-- Some Comment with leading double-dashes.
-- Created by Joe Admin on 10/11/2017.
Port 7809
DynamicPortList 9001–9100
Autostart ER *
AutoRestart Extract *, WaitMinutes 2, Retries 5
LagReportHours 1
LagInfoMinutes 3
LagCriticalMinutes 5
PurgeOldExtracts ./dirdat/rt*, UseCheckpoints
Port: Establishes TCP/IP port number on which Manager listens for requests.
DynamicPortList : specifies the ports that Manager can dynamically allocate
Autostart:specifies he processes that are to be automatically started when Manager starts
AutoRestart: Specifies the processes to be restarted after abnormal termination
LagReportHours: Sets the interval, in hours, at which Manager checks the lag for Extract
and Replicat processing. Alternatively, this can be set in minutes.
LagInfoMinutes: Specifies the interval at which Extract and Replicat will send an
informational message to the event log. Alternatively, this can be set in seconds or hours.
LagCriticalMinutes: Specifies the interval at which Extract and Replicat will send a
critical message to the event log. Alternatively, this can be set in seconds or hours.
PurgeOldExtracts: Purges the Oracle GoldenGate trails that are no longer needed, based
on option settings
 Server Collector: Also known simply as Collector
 Extract: Committed transactions are captured (and can be filtered) as they
occur by reading the transaction logs.It is also known as Change Data Capture
•Extract writes data to any of the following:
– Local trail (ExtTrail) on the local system
– Local file (ExtFile) on the local system
– Remote trail (RmtTrail) on a remote system
– Remote file (RmtFile) on a remote system
Extract trails and files are unstructured, with variable length records.
– I/O is performed using large block writes.
•Extract writes checkpoints for trails during change capture:
– This guarantees that no data is lost during restart.
– Multiple Replicat processes may process the same trail.
•Extract does not write checkpoints for files.
Extract Trails and Files Contents
• Each record in the trail contains an operation that has been committed in the source
database.
• Committed transactional order is preserved.
• Operations in a transaction are grouped together in the order in which they were applied.
• By default, only the primary key and changed columns are recorded.
• Flags indicate the first and last records in each transaction.
• Starting from Oracle GoldenGate release 12.2, the tra information about database objects being replicated.
Example

Start a Manager process:
GGSCI> Start Mgr
•Add an Extract group:
GGSCI> Add Extract myext, Integrated TranLog, Begin Now
•Add a local trail:
GGSCI> Add ExtTrail /ggs/dirdat/lt, Extract myext

Start an Extract group:
GGSCI> Start Extract myext

In this example, a primary extract named myext extracts database changes from the transaction
logs starting with records generated at the time the group was created. The changes will be written
to a local trail (lt). then an extract is started, when extract is started .It  creates a new trail file
rather than appending to existing trail file.

Overview of Trails
• Trails are used in Oracle GoldenGate to support the continuous extraction and
replication of database changes.
• A trail can exist on the source or target system, or on an intermediary system.
• Only one primary Extract process writes to a trail.
• Processes that read the trail include:
– Data pump Extract
– Replicat

Adding a Local or Remote Trail

Add a local or remote trail with the GGSCI command:
GGSCI> Add ExtTrail | RmtTrail <trail_name>
, Extract <group_name>
[, Megabytes <n>]
•
If you are using a data pump:
– The primary Extract needs a local trail (ExtTrail)
– The data pump Extract needs a remote trail (RmtTrail)
GGSCI> Add Extract
GGSCI> Add Extract ExtTrail /u01/app/ogg/dirdat/aa,
finance, Megabytes 10
RmtTrail /u01/app/ogg/dirdat/bb,parts, Megabytes 5

On the local system, a trail is known as Extract trail(or local trail).
 On a remote system, it is known as a remote trail
the primary extract write to a local trail. The data pump Extract sends
changes to a remote trail. The default file size is 500 MB.
In this example, the parts Extract file is set to 5 MB.

Passthru: This parameter is used on a data pump if you do not need to perform any data transformations
Datapumpt: A secondary Extract process that reads from a local trail  and distributes that data to a remote system
it allow a local trail on source system  which is useful for recovery if the network or target system fails
RmtHost is used to identify the name or IP address of the remote system and the port that is
being used.
• Start an Extract process with the GGSCI command:
GGSCI> Start Extract <group_name>
GGSCI> Info Extract <group_name>
•
If the output trail is remote, this normally triggers the target Manager process to start a
Server Collector process with default parameters.
Primary Extract Configuration for Oracle
GGSCI> Edit Params finance
Extract finance
UserIDAlias oggalias
ExtTrail /ggs/dirdat/lt
Table SALES.ORDERS;
Table SALES.INVENTORY;
or
GGSCI> View Params somename
-- Created by Joe Admin on 10/11/2017.
Extract somename
-- UserIDAlias oggalias
RmtHost mytarget.example.com, MgrPort 7909
RmtTrail ./dirdat/rt
Passthru
Table SALES.ORDERS;
Table SALES.INVENTORY;
 • UserID and Password supply database credentials.
 • if running with Passthru ,The UserID lines are not required for data pumps, only for primary extracts.
 • RmtHost specifies the target system; the MgrPort option specifies the port where Manager is running
 • RmtTrail specifies the Oracle GoldenGate path and trail file prefix on the target system.
 • The system will append 000000000, 000000001, 000000002, and so on to the file name prefix.
 • Table specifies a source table for which activity will be extracted.
• Data Pump: Optional; highly recommended.GoldenGate distributes data for routing to targets.• An Extract data pump can write to one or multiple remote trails and/or servers(not to be confused with Oracle Data Pump).• A data pump:– Reads the local trail– Manipulates the data or passes it through without change– Sends the data to one or more targets•A data pump is useful:– As a safeguard against network and target failures•A data pump is useful:
– To break complex data filtering and transformation into phases– To consolidate data from many sources
– As a safeguard against network and target failures– To break complex data filtering and transformation into phases– To consolidate data from many sources– To synchronize one source with multiple targets •Replicat: Replicat applies data with transaction integrity, transforming the data as required.• Trails or extract files: Can optionally be compressed and/or encrypted-GoldenGate stages and queues data for routing.GGSCI> Edit Params mypumpGGSCI> Edit Params mypump
Extract mypump PassthruRmtHost <target>, MgrPort <port>RmtHost <target>, MgrPort <port>
RmtTrail ./dirdat/rtTable SALES.ORDERS;Replicat
Table SALES.INVENTORY;Extract mypump PassthruRmtTrail ./dirdat/rtTable SALES.ORDERS;Table SALES.INVENTORY;
• The Replicat process runs on the target system.
• Multiple Replicat processes can be used with multiple Extract processes in parallel to
increase throughput.
• Replicat can:
– Read data out of Oracle GoldenGate trails
– Perform data filtering by table, row, or operation
– Perform data transformation
– Perform database operations just as your application performed them

 Oracle GoldenGate trails are temporary queues for the Replicat process.
Each record header in the trail provides information about the database change record.
 Replicat reads these trail files sequentially and then processes
INSERTs ,UPDATEs and DELETs that meets your criteria.
Replicate parameters specify the following:
• A group name that is also associated with a checkpoint file
• A list of source-to-target relationships:
  – Optional row-level selection criteria
  – Optional column mapping facilities
  – Optional transformation services
  – Optional stored procedure or SQL query execution
• Error handling
• Various optional parameter settings
Replicat Parameter Defaults
Replicat parameters can be modified or can assume a default value:
• Apply all insert, update, or delete operations.
• Smart transactional grouping is possible.
– 1,000 source operations are grouped into a single target transaction.
•Process ABENDs on any operational failure:
– Rollback of transactions to the last good checkpoint
– Optional error handling
– Optional mapping to secondary table for exceptions
Sample Replicat Parameter File
- Created by Joe Admin on 10/11/2017.
Replicat salesrpt
SetEnv (ORACLE_SID = 'orcl')
UserID ggsuser@myorcl, Password ggspass
-- UserIDAlias oggalias
DiscardFile ./dirrpt/SALESRPT.dsc, Append
Map HR.STUDENT, Target HR.STUDENT
Where (STUDENT_NUMBER < 400000);
Map HR.CODES, Target HR.CODES;
Map SALES.ORDERS, Target SALES.ORDERS,
Where (STATE = 'CA' AND OFFICE = 'LA');
Replicat names the group that links the process, checkpoints, and log files together.
Map links the source tables to the target tables and applies mapping, selection, error
handling, and data transformation, depending on options. Because the Map statements are
terminated with a semi-colon, they may span multiple lines in the parameter text file without
any special continuation characters
Initial load : Initial load is a data migration process that is performed only once.

Prerequisites for Initial Load
• Disable DDL processing.
• Prepare target tables.
• Configure the Manager process.
• Create a data definitions file (if the source and target databases have dissimilar
definitions).
• Create change-synchronization groups (for capture and replication transactional
changes during the initial load).
• Share parameters between process groups

SourceIsTable :SourceIsTable instructs Extract to read the source tables directly
rather than from the transaction log.

RmtTask : RmtTask instructs the Manager process on the target system to start a
Replicat process with a group name specified in the Group clause.


When you add Extract and Replicat:
•SourceIsTable instructs Extract to read the source tables directly rather than the
transaction log.
SpecialRun: SpecialRun on Replicat specifies a one-time batch processing
where checkpoints are not maintained.
•The initial data load is then started using the GGSCI command Start Extract.
The Replicat process is automatically started by the Manager process. The port used
by the Replicat process can be controlled by using the DynamicPortList Manager
parameter.
 Oracle GoldenGate uses two types of parameter files:
– GLOBALS file: Stores parameters that relate to the Oracle GoldenGate instance as a
whole
 •GLOBALS parameters apply to all processes.
– These are set when Manager starts.
– They reside in <OGG_HOME>/GLOBALS.
•GLOBALS parameters:
– Control things that are common to all processes in an Oracle GoldenGate instance
– Can be overridden by parameters at the process level

After you add or change any GLOBALS parameters,
you must exit GGSCI for the new parameters to take effect.

To create a parameter file in GGSCI, use the EDIT PARAM option.
• The GLOBALS parameter file is identified by its file path:
GGSCI> Edit Param ./GLOBALS

•Process parameters apply to a specific process
(Manager, Extract, Server Collector, Replicat, and utilities).
– These are set when the process starts.
– They override GLOBALS settings.
– By default, they reside in the dirprm directory in files named <processname>.prm.
– Most apply to all the tables that are processed, but some can be specified at table level.
– Run-time parameter file: Is coupled with a specific process (such as Extract)
•By default, parameter files are in dirprm in the Oracle GoldenGate directory.
Extract Flavors
Integrated Extract:
• Is an Oracle GoldenGate Extract for Oracle databases
• Is multithreaded
• Relies on Oracle’s internal log parsing and processing implementation
• Supports more data types
• Supports downstream topologies
• Is available with OGG version 11.2.1 and later
Classic Extract:
• Is traditional REDO log–based extract for Oracle
• Works for all supported DB platforms and versions
Capture and Delivery Work Flow without pump
On the source system
1. An  Extract process captures transactional changes from transaction logs.
2. The Extract process sends data across a TCP/IP network to the target system.
On the target system:
1. A Server Collector process reassembles and writes the data to an Oracle GoldenGate trail.
2. A Replicat process reads the trail and applies it to the target database. (This can be
concurrent with data capture or performed later.)
Manager processes on both systems control activities such as starting, monitoring, and restarting
processes; allocating data storage; and reporting errors and events.
Capture and Delivery Using a Data Pump
On the source system
1. An  Extract process captures transactional changes from transaction logs.
2. The Extract process writes a local oracle golden gate trail .
3. A second Extract process (called a data pump) sends the data across the network to the target system.

On the target system:
1. A Server Collector process reassembles and writes the data to an Oracle GoldenGate trail.
2. A Replicat process reads the trail and applies it to the target database. (This can be
concurrent with data capture or performed later.)
Manager processes on both systems control activities such as starting, monitoring, and restarting
processes; allocating data storage; and reporting errors and events.
COMMANDS
• Info: Displays information about an object (status, and so on)
• Kill: Forces a process to stop (no restart)
• Lag: Displays the lag between when a record is processed by the process and the
source record time stamp
Refresh: Refreshes Manager parameters (except port number) without stopping
Manager
• Delete: Deletes an object or disables TranData or SchemaTranData capture
• Send: Sends commands to a running process
• Start: Starts a process
• Stats: Displays statistics for one or more processes
• Status: Indicates whether a process is running
• Stop: Stops a process gracefully
• View GGSEvt: Displays the Oracle GoldenGate event/error log
• View Report: Displays a process report for Extract or Replicat
• Info All: Displays the status and lag for all Oracle GoldenGate online processes on a
system (Info All AllProcesses also displays tasks.)
TranData: Enables supplemental logging of primary keys and/or indexes for a schema or table in the transaction logs.
Also, use SchemaTranData for all the present and future tables
Checkpoint :Replicat maintains checkpoints that provide a known position in the trail from
which to start after an expected or unexpected shutdownBy default a record of these checkpoints is maintained in a trail file on disk in oracle Golden directory
Optionally, the checkpoint record can also be maintained in a checkpoint table in the target database
Using database checkpointing is recommended because It enables the checkpoint to be included within Replica's transaction
 which improves recovery in certain situations. The checkpoint table
remains small because rows are deleted when no longer needed, and it does not affect database performance.
It can reside in a schema of your choice, but Oracle Corporation recommends using one that is dedicated to Oracle GoldenGate.
Both Extract and Replicat maintain checkpoints into the trails. Checkpoints provide persistent
processing whenever a failure occurs. Each process resumes where the last checkpoint was saved,
guaranteeing that no data is lost. One Extract can write to one or many trails. Each trail can then be
processed by one or many Replicat processes.
Oracle GoldenGate Classic Replicat checkpointing
One of the key aspects for replication is checkpointing. A target database checkpoint tells which transactions are actually committed and which not yet. This is a key aspect of transactional replication. Let’s look how that works for the Oracle GoldenGate Classic Replicat.Disclaimer: This article is just about Classic Replicat and single thread. It is just an introduction to a bigger topic. I have read this text after writing and I’ve noticed that all this is very obvious, but it may be an introduction for somebody who is new in this subject.
For Integrated Replicat and other parallel replication techniques the picture is a bit more complicated and will be covered later.
1. Source database (Redo)
No matter what how the transactions are interleaved on the source database what is most important for replication is the order of the COMMIT operations.It might be strange in the beginning but it does not matter what is the actual SCN (or timestamp) of the operations in the source database. What matters is the time stamp (and the order, or SCN) of the commit operation. The commit defines the order of the transactions that appeared in the source database.
On the image above there were 3 transactions:
- T1 has some DML operations and a commit at SCN 190,
- T2 has some DML operations and a rollback which caused some UNDO operations to revert the changes – and also a commit at the end,
- T3 has some DML operations and a commit at SCN 150.
2. The trail
According to COMMIT sequence the first transaction that will be replicated is T3 – at SCN 150. Then T1 – at SCN 190. T2 since it was rolled back would not appear in the trail files. The Extract process will automatically ignore it, as it never happened. It has no importance for replication. It might just have never happened and the effect would be the same.The OGG trail will only contain: T3 transaction and T1 transaction. OGG does not write a special commit record in the trail. All DML operations that appear in the trail have special signatures (TransInd) which describes the context of this DML: the beginning (0), the middle (1) or end (2) of transaction or single DML operation transaction (3).
Everything what is in Trail files consist of committed pure transactions. No rolled back transactions are here. It is also important, to note, that transactions are not being interleaved in the trail files. They appear in the exact commit order.
What we know at this point? No matter what was the interleaving of particular DML’s in the source database, to replicate the transactions to the target database they must be executed in the exact order of the commit sequence – according to the SCN’s of the commit operations in the source database.
3. Trail checkpointing
The architecture of trails shows that there is no additional checkpointing in the trail itself. Every trail file does not have an additional second file with the checkpoint. There is just a checkpoint file (in dirchk folder) attached to the process that shows the information what is the latest CSN in the trail, but the trail itself is just a queue.If anything goes wrong, then the process (Extract or Replicat) might go some time back in the source and get missing information that was lost and is partially written to the trail.
4. Target database checkpointing
Just looking at the architecture reveals an important thing: just committing sole transactions without checkointing information to the target database is not enough. The checkpoint table in the target database is crucial. In most possible cases you need it anyway.There might be situations where it would be very difficult to tell what is the exact position of the Replicat process. Which transactions are committed and which are not. In case of a complex replication (like using INSERTALLRECORDS) it is not possible to reveal the information what is committed and what not. And you can’t just use HANDLECOLLITIONS to somehow manage that.
For example:
- The Replicat process was restarted and did hot have enough time to write information about the committed transaction in the checkpoint file, but the transaction in the database got committed. It is virtually not possible to update the OGG checkpoint file at the exact same time as the database makes the commit. In case of failure you might get out of sync;
- The target database has been recovered from backup to an earlier timestamp (committed SCN from source). Suddenly you have earlier transactions committed in the target database and you might want to “go back in time” with the replication (using ALTER REPLICAT ATSCN);
- The OGG checkpoint file has been corrupted and the Replicat needs to be recovered (restore files from backup with an earlier version of file checkpoint),
5. Checkpoint table
A checkpoint table comes to the rescue. There is one row in the checkpoint table per one Replicat. This row in column tells the SCN (named here by OGG as CSN) of last committed transaction. This information is stored in column LOG_CSN (or LOG_CMPLT_CSN). Actually for one thread those columns should be equal. This table is managed very easily: the row in checkpoint table is updated together with every one replicated transaction (or group of transactions). A special UPDATE command is executed at the end of the transaction.This way the internal transaction mechanism inside the database will keep up to date information about what is exactly replicated and what not yet. After any of the scenarios (mentioned above) it is possible to exactly position the Replicat in the exact place where it finished earlier. Even all trails and checkpoints could become corrupted an recreated (from Redo and Archive logs) and still it is possible to fully recover the replication without any loss. You might even have to setup the replication from scratch. All you might need is the redo/archive logs from the source database for the missing period.
Pros:
- A fool-proof approach available in OGG Classic Replicat for all databases architectures (Oracle, SQL Server, DB2, Sybase, MySQL, etc),
- This idea is very simple and covers many disaster scenarios,
- Works also with batching – the checkpoint record can be assigned to many combined-in-one transactions,
- Works also with not synchronized (no wait) commit – it does not influence the atomicity of the transactions,
- No risk of transaction duplication in worst-case scenario.
- In this simple approach works only in single threaded replication – for multi-threaded replication the trick with one CSN (SCN) position and one row per Replicat does not work,
- Performance impact – requires one additional UPDATE operation per every replicated transaction (or grouped transaction),
- Polluting the target database with one extra table – the solution requires adding additional the target database.
Troubleshooting Oracle GoldenGate
Extract
If there are any errors, the extract would appear as STOPPED. In this case, you have to investigate the errors.
First, check the report file C:\OGG10G\dirrpt\EMP_EXT.rpt.
Next, see if there are any indicative messages in the log files ggserr.log and sqlnet.log, which are in the main C:\OGG10G directory.
The ggserr.log file contains event information such as:
2009-12-02 14:53:26 GGS INFO 301 Oracle GoldenGate
Manager for Oracle, mgr.prm: Command received from GGSCI on host 10.10.10.10 (START EXTRACT EMP_EXT ).
2009-12-02 14:53:26 GGS INFO 302 Oracle GoldenGate Manager for Oracle, mgr.prm:
EXTRACT EMP_EXT starting.
These events can also be seen in the following way:
GGSCI (AnonDB) 1> VIEW GGSEVT
…
….
2009-12-02 15:09:34 GGS INFO 302 Oracle GoldenGate Manager for Oracle,
mgr.prm: EXTRACT EMP_EXT starting.
2009-12-02 15:13:26 GGS INFO 399 Oracle GoldenGate Command Interpreter
for Oracle: GGSCI command (AnonDB): EDIT PARAM emp_ext.
The sqlnet.log file may show errors such as
TNS-12557: TNS:protocol adapter not loadable
This particular error indicates a database connection issue, so you need to explore at the listener level. Make sure the Path includes the Oracle Home bin subdirectory right at the start. There may be other TNS errors that may indicate other solutions.
EMP_EXT.rpt may show an error such as the following:
2009-12-08 13:01:27 GGS ERROR 182 OCI Error beginning
session (status = 28009-ORA-28009: connection as SYS should be as SYSDBA or SYSOPER).
2009-12-08 13:01:27 GGS ERROR 190 PROCESS ABENDING.
This indicates that the Extract process is trying to log on as sys without being the SYSDBA. Simply change the login in the parameter file for the Extract to “system”.
I should note here that specifying SYSDBA at the end of the login line in the Extract parameter file doesn’t work, although it does work with the DBLOGIN command in GGSCI that you will see next.
The ggserr.log file may show similar errors:
2009-12-03 00:43:16 GGS INFO 399 Oracle GoldenGate
Command Interpreter for Oracle: GGSCI command (AnonDB): start manager.
2009-12-03 00:43:25 GGS ERROR 182 Oracle GoldenGate
Manager for Oracle, mgr.prm: OCI Error during OCIServerAttach
(status = 12154-ORA-12154: TNS:could not resolve the connect identifier specified).
2009-12-03 00:43:25 GGS ERROR 190 Oracle GoldenGate
Manager for Oracle, mgr.prm: PROCESS ABENDING.
This indicates an issue with the login credentials supplied in the Manager parameter file, mgr.prm. The Manager has not started as a result.
Another possible error can be seen in the Extract report file. For example, EMP_EXT.rpt can have this error:
2009-12-07 16:40:08 GGS ERROR 190 No minimum supplemental
logging is enabled. This may cause extract process to handle key
update incorrectly if key column is not in first row piece.
2009-12-07 16:40:08 GGS ERROR 190 PROCESS ABENDING.
The solution to this is obviously to enable supplemental logging at the database level. C
Replicat
The first step is to use the GGSCI command DBLOGIN to connect to the database, so that other commands can be issued that will work on the database.
Note that DBLOGIN works fine as follows:
GGSCI ( AnonDB) 1>
DBLOGIN USERID system@localhost:1521/FIPRD3 PASSWORD fipassword1
Successfully logged into database.
Now you need to add a checkpoint table for the employees table that you are replicating:
GGSCI ( AnonDB) 2> ADD CHECKPOINTTABLE HR.EMPLOYEES_CHKPT
Successfully created checkpoint table HR.EMPLOYEES_CHKPT.
Checkpoints that are stored in this table refer to the current read and write positions of the Replicat process. This is used to prevent the loss of data in case the process needs to be restarted, or if there is any fault in the server or a hiccup in the network that would otherwise result in data loss. The other advantage is that multiple Extract or Replicat processes can be read from the same set of trails by using checkpoints.
Checkpoints are optional in the sense that they are not required for Extract and Replicat processes that run in batch mode, because such processes can always be restarted. However, checkpoints are necessary in the case of continuously operating Extract and Replicat processes.. They are normally maintained as files in the dirchk subdirectory, but in the case of Replicat they can optionally be stored in the database in the checkpoint table.
If you specify the checkpoint table in the GLOBALS parameter file, the above command can use that specification. In this scenario, the command could simply be
GGSCI (AnonDB) 3> ADD CHECKPOINTTABLE
No checkpoint table specified, using GLOBALS specification (hr.employees_chkpt).
Successfully created checkpoint table HR.EMPLOYEES_CHKPT.
You can now add the Replicat group as follows, specifying the exact same EXTTRAIL that was used by the Extract group set up in the first database. So the Replicat group feeds on or consumes the trail created by the Extract group:
GGSCI (AnonDB) 4> ADD REPLICAT emp_rep, EXTTRAIL C:\OGG10G\dirdat\et, CHECKPOINTTABLE hr.employees_chkpt,
REPLICAT added.
Edit the parameter file for this Replicat group as follows:
GGSCI (AnonDB) 5> EDIT PARAM emp_rep
In the new file, enter the following:
REPLICAT emp_rep
USERID system@localhost:1521/FIPRD3, PASSWORD fipassword1
ASSUMETARGETDEFS
MAP hr.employees, TARGET hr.employees;
Because the tables have exactly the same DDL structure, you use the ASSUMETARGETDEFS parameter.
Now you can start the Replicat group:
GGSCI (AnonDB) 6> start REPLICAT emp_rep
Sending START request to MANAGER (‘GGSMGR’) …
REPLICAT EMP_REP starting
Wait a few seconds to see the status; if you try immediately, the status may say “stopped.” When you see the status as “running”, check the detailed information, and also issue an info all command to show all running processes:
GGSCI (AnonDB) 7> status REPLICAT emp_rep
REPLICAT EMP_REP: STOPPED
GGSCI (AnonDB) 8> status REPLICAT emp_rep
REPLICAT EMP_REP: RUNNING
GGSCI (AnonDB) 11> info REPLICAT emp_rep detail
REPLICAT EMP_REP Last Started 2009-12-08 13:35 Status RUNNING
Checkpoint Lag 00:00:00 (updated 00:00:01 ago)
Log Read Checkpoint File C:\OGG10G\dirdat\et000001
2009-12-08 13:33:24.000000 RBA 985
Extract Source Begin End
C:\OGG10G\dirdat\et000001 2009-12-08 13:33 2009-12-08 13:33
C:\OGG10G\dirdat\et000000 * Initialized * 2009-12-08 13:33
Current directory C:\OGG10G
Report file C:\OGG10G\dirrpt\EMP_REP.rpt
Parameter file C:\OGG10G\dirprm\EMP_REP.prm
Checkpoint file C:\OGG10G\dirchk\EMP_REP.cpr
Checkpoint table HR.EMPLOYEES_CHKPT
Process file C:\OGG10G\dirpcs\EMP_REP.pcr
Error log C:\OGG10G\ggserr.log
GGSCI (AnonDB) 12> info all
Program Status Group Lag Time Since Chkpt
MANAGER RUNNING
EXTRACT RUNNING EMP_EXT 00:00:00 00:00:03
REPLICAT RUNNING EMP_REP 00:00:00 00:00:06
Troubleshoot Oracle GoldenGate lag
What is lag?
Lag is the time difference between when changes are made within the source database and when those changes are applied to the target database. This article discusses the following types of lag:Extract lag: The difference, in seconds, between the system clock time that a record was processed by the Extract GoldenGate component and the timestamp of that record in the data source.
Replicat lag: The difference, in seconds, between the system clock time that the last record was processed by the Replicat GoldenGate component and the timestamp of the record in the trail files, which are a record of the transactions.
Monitor lag
You can monitor lag with the following GoldenGate Manager parameters (found in mgr.prm):– LAGINFO {seconds | minutes | hours}: the basic informational warning lag threshold – LAGREPORT {minutes | hoursS}: the interval at which Manager checks for lag – LAGCRITICAL {seconds | minutes | hours}: the critical warning lag threshold
You can also monitor ggserr.log for latency information and review database query statistics in the GoldenGate dynamic performance views.
Obtain lag information
Use the following GoldenGate Software Command Interface (GGSCI) lag commands to obtain lag statistics for running Oracle GoldenGate Groups:LAG EXTRACT
UseLAG EXTRACT to determine the true lag time between Extract and the data
source, as shown the following example:LAG EXTRACT group_name
2018-08-17 23:09:31  INFO    OGG-14054  Lag from heartbeat table requires DBLOGIN.

Sending GETLAG request to EXTRACT EXT1 ...
Last record lag 4 seconds.
At EOF, no more records to process
LAG REPLICAT
UseLAG REPLICAT to determine the true lag time between Replicat and the
trail, as shown in the following example:LAG REPLICAT group_name
2018-08-17 23:02:49  INFO    OGG-14054  Lag from heartbeat table requires DBLOGIN.
Sending GETLAG request to REPLICAT REP1 ...
Last record lag 6 seconds.
Low watermark lag: 67.
High watermark lag: 8.
Low watermark position: 68765101167.
High watermark position: 68765101638.
At EOF, no more records to process
Control how lag is reported
Use theLAGREPORTMINUTES or LAGREPORTHOURS parameter to specify the interval
at which Manager checks for Extract and Replicat lag.Use the
LAGCRITICALSECONDS, LAGCRITICALMINUTES, or LAGCRITICALHOURS
parameter to specify a lag threshold that is considered critical and to force a
warning message to the error log when the threshold is reached. This parameter
affects Extract and Replicat processes on the local system.Use the
LAGINFOSECONDS, LAGINFOMINUTES, or LAGINFOHOURS parameter to
specify a lag threshold. If the lag exceeds the specified value, GoldenGate
reports lag information in the error log. If the lag exceeds the value specified
with the LAGCRITICAL parameter, Manager reports the lag with a critical
warning. Otherwise, it reports the lag with an informational message.Analyze lag
Before trying to diagnose lag and potential bottlenecks in a GoldenGate environment, you should first understand the flow of data between the source and target databases, as shown in the following figure: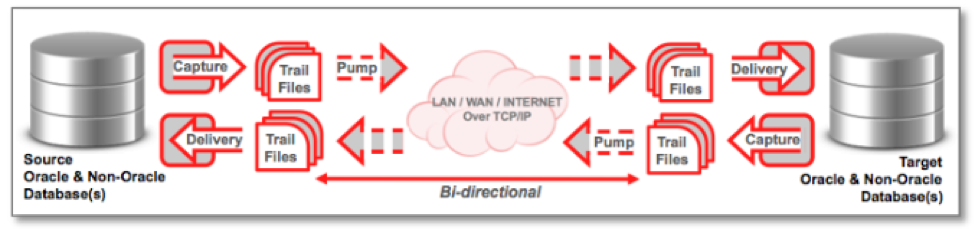
Image source: https://bit.ly/2OGREey
The following components can contribute to performance bottlenecks:
- Extract reads the Oracle log files and captures any required data for replication.
- Extract carries out any mapping and conversion of the data and writes to the trail files.
- Data Pump reads the trail files and carries out any required mapping and conversion of the data.
- Data Pump transfers the trail files from the source system to the target system, where Collector writes to the remote trail files.
- Replicat reads the trail file, applies any mapping and conversions, and applies the data to the target database by using SQL statements.
Gather diagnostic lag information
To monitor GoldenGate performance, several key pieces of information must be gathered and analyzed. You should gather performance data on both the source and target environments for the same period to get a clear picture of lag.Diagnostic information can be gathered from the following sources:
- Extract and Replicat report files and error logs
- Extract and Replicat statistics
- Database views
- Automatic Workload Repository (AWR) and Active Session History (ASH) reports
- Oracle Streams Performance Advisor
- Integrated Extract and Replicat Health Check report
Reduce lag
The following sections offer suggestions to troubleshoot and reduce lag within various GoldenGate components.Tune Extract
Tune Extract by using the following techniques:– Use the
LOGALLSUPCOLS parameter to instruct Extract to write
supplemental logged columns to the trail file.
– Use the PARALLELISM parameter to control the number of preparers for
processing logs. The Enterprise Edition allows for parallelism of preparers.
- Avoid having long transactions.
- Increase the input and output (I/O) throughput of the machine running
Extract, especially write throughput.
- Split large tables into row ranges across process groups.Tune Pump
Tune Pump by using the following techniques:- Remove unnecessary processing in Pump.
- Try to use the
COMPRESSIONfeature. - Optimize network delivery by increasing the
TCPBUFSIZEandTCPFLUSHBYTESparameter sizes.
Tune Replicat
Tune Replicat by using the following techniques:- Use the
BATCHSQLparameter, which improves the apply performance in the majority of workloads - Parallelize the Replicat apply by using integrated (IR) or coordinate replicat (CR) features.
- Optimize target database SQL execution.
- Use the
EAGER_SIZEthreshold to begin to apply transactions before a commit is received. The default is 9500.
Tune GoldenGate in general
Use the following techniques to tune GoldenGate in general:- Use multiple process groups.
- Split large tables into row ranges across process groups.
- Configure GoldenGate to use the network efficiently.
- Eliminate disk I/O bottlenecks.
- Manage virtual memory and paging.
- Optimize data filtering and conversion.
-------------Login on orcl note cdb database---------------

show parameter enable_goldengate
alter system set enable_goldengate_replication=true scope=both
SELECT supplemental_log_data_min, force_logging FROM v$database;
ALTER DATABASE ADD SUPPLEMENTAL LOG DATA;
ALTER DATABASE FORCE LOGGING;
SELECT supplemental_log_data_min, force_logging FROM v$database;
exec dbms_goldengate_auth.grant_admin_privilege('C##OGG_ADMIN',container=>'all');
DBLogin UserID c##OGG_Admin@amer, Password oracle_4U
add schematrandata west
GGSCI (edvmr1p0 as c##OGG_Admin@orcl/AMER) 5> add schematrandata west
Oracle Goldengate support native capture on table WEST.BRANCH_ATM.
Oracle Goldengate marked following column as key columns on table WEST.BRANCH_ATM: BRANCH_NUMBER, ATM_NUMBER, TRANS_NUMBER, ATM_TRANS_TS.
2019-07-29 12:29:57  INFO    OGG-10471  ***** Oracle Goldengate support information on table WEST.TELLER *****
Oracle Goldengate support native capture on table WEST.TELLER.
Oracle Goldengate marked following column as key columns on table WEST.TELLER: TELLER_NUMBER.
2019-07-29 12:29:57  INFO    OGG-10471  ***** Oracle Goldengate support information on table WEST.TELLER_TRANS *****
Oracle Goldengate support native capture on table WEST.TELLER_TRANS.
Oracle Goldengate marked following column as key columns on table WEST.TELLER_TRANS: TELLER_NUMBER, TRANS_NUMBER, TELLER_TRANS_TS.
GGSCI (edvmr1p0 as c##OGG_Admin@orcl/AMER) 6>
golden gate external training
info schematrandata west
GGSCI (edvmr1p0 as c##OGG_Admin@orcl/AMER) 6> info schematrandata west
2019-07-29 12:31:25  INFO    OGG-06480  Schema level supplemental logging, excluding non-validated keys, is enabled on schema "WEST".
2019-07-29 12:31:25  INFO    OGG-01980  Schema level supplemental logging is enabled on schema "WEST" for all scheduling columns.
2019-07-29 12:31:25  INFO    OGG-10462  Schema "WEST" have 6 prepared tables for instantiation.
GGSCI (edvmr1p0 as c##OGG_Admin@orcl/AMER) 7>
DynamicPortList 20000-20099
PurgeOldExtracts ./dirdat/*, UseCheckPoints, MinKeepHours 2
Autostart Extract E*
AUTORESTART Extract *, WaitMinutes 1, Retries 3
alter CredentialStore Add User C##OGG_Admin@amer password oracle_4U Alias oggadmin_amer
alter CredentialStore Add User C##OGG_Admin@euro password oracle_4U Alias oggadmin_euro
GGSCI (edvmr1p0) 1> info all
Program     Status      Group       Lag at Chkpt  Time Since Chkpt
MANAGER     RUNNING
GGSCI (edvmr1p0) 2> create wallet
Created wallet at location 'dirwlt'.
Opened wallet at location 'dirwlt'.
GGSCI (edvmr1p0) 4> add credentialStore
Credential store created in /u01/ogg/oggsrc/dircrd/.
GGSCI (edvmr1p0) 5>
GGSCI (edvmr1p0) 5> alter CredentialStore Add User C##OGG_Admin@amer password oracle_4U Alias oggadmin_amer
Credential store in /u01/ogg/oggsrc/dircrd/ altered.
 Approach to Troubleshoot an Abended OGG Process
https://www.oracle-scn.com/approach-to-troubleshoot-an-abended-ogg-process/
http://mygoldengat.blogspot.com/2016/04/troubleshooting-oracle-goldengate.html
https://www.google.com/url?sa=t&rct=j&q=&esrc=s&source=web&cd=4&cad=rja&uact=8&ved=2ahUKEwiZyYWNs-bkAhWXb30KHZ9nDdwQFjADegQIAxAB&url=https%3A%2F%2Fk21academy.com%2Foracle-goldengate-12c%2Fsolved-oracle-goldengate-extract-replicat-abended-ogg-02091operation-not-supported%2F&usg=AOvVaw0SQRvNEgwWQwme0V_lTkBD
THREE BASIC FILES
There are many files which needs to be checked whenever
you face issue in Oracle GoldenGate.
Out of which Oracle GoldenGate logs the activity in three files.
1. Error Log File – ggserr.log
2. Report File
3. Discard File
4. Trace File
5. Alert Log File
6. DDL Trace File
The first three are the very basic, also can be called as major files
which are to be looked in to whenever there are problems in the Oracle GoldenGate.
Below, is the explanation for these three files.
What is Error Log file – ggserr.log?
This file is created during the Installation of the Oracle GoldenGate.
The file is created in the Oracle GoldenGate home directory with the name ggserr.log.
For each installation of Oracle GoldenGate, a ggserr.log file is created in the respective Oracle GoldenGate directory.
This file is updated by all the processes of Oracle GoldenGate and
the below information are logged in this file.,
Start and Stop of the Oracle GoldenGate Processes. Processing Information like Bounded Recovery operations. Error Messages. Informational messages like normal operations happening in Oracle GoldenGate. WARNING Messages like Long Running Transactions. Commands executed in GGSCI Prompt.
The format in which the Oracle GoldenGate processes logs the information in to this ggserr.
log file is below.,
You can view this file in the ggsci prompt itself by using the command VIEW GGSEVT.
But it is always better to view it using the OS tool as this file can grow a lot.
The below is the example., So with the ggserr.log file you basically identify the below., What is the Error? When the Error occurred? How Frequently it occurred? What were the operations performed before the Error occurred? How Frequently the error occurred? What is Report File? A Report file is a process specific log file. Each process has its own report file created
and this file is created during the instantiation of the process.
This file is stored in the directory /dirrpt and the format of this file is .rpt.
This file is automatically renamed on the next instantiation of the process.
If a process starts all the log entries for that process are written to its respective report file.
Let’s consider a process called EXT and the report file
during instantiation of this process is called as EXT.rpt.
If this process is stopped and started again,
existing file EXT.rpt will be automatically renamed to EXT0.rpt and
a new file will be generated with the name EXT.rpt and
this occurs recursively till the value of the sequence reaches 9.
If the last report file name for the process EXT is created as EXT9,
now during the new file generation, the last file EXT9.rpt will be removed and EXT8.rpt will be renamed as EXT9.rpt.
So, the report file with the lower sequence value will be the latest and younger one when compared with older sequence valued report file.
REPORTROLLOVER parameter is used to manually or forcefully create a new report file for the processes. To view the current report of the process the below command is used.,
To get the runtime statistics report of a process,
use the below command,
The below information can be seen in the report file of a particular process.,
Oracle GoldenGate Product Version and Release Operating Version, Release, Machine Type, Hostname and Ulimit settings of the respective process Memory Utilized by the respective process Configured Parameters of the respective Oracle GoldenGate Process Database Provider, Version and Release Trail files Information Mapping of Tables Informational messages with respective to a particular process Warning messages with respective to a particular process Error messages with respective to a particular process All DDL Operations performed. All the Discarded Errors and Ignored Operations Crash dumps Any commands which are performed on that particular process. The below is the example of the Report file which I had split it to many parts
so that you will get an clear understanding. 1. Oracle GoldenGate Product Version and Release. Operating Version, Release, Machine Type, Hostname and Ulimit settings of the respective process 2. Configured Parameters of the respective Oracle GoldenGate Process 3. Database Provider, Version, Release and Trail File information. 4. Mapping of tables and Informational messages with respect to the Process. 5. Crash dump and Error messages of the respective process. Above examples clearly shows the contents of a Report file. So with the help of a Report file, the following can be known, In which Trail File the Process gets Abend. Whether the Trail File is moving forward? Whether the process is getting failed with Same Trail File? What operations has been performed before the process abend? Whether any errors in the Parameter configuration? Whether the MAP statements has the correct table names? What is Discard File? A log file for logging failed operations of the Oracle GoldenGate processes.
It is mainly used for Data errors. In Oracle GoldenGate 11g, this file is not created by default.
We have to mention a keyword DISCARDFILE to enable discard file logging.
But from Oracle GoldenGate 12c, this file is generated by default during the instantiation of the process
The Naming format of the Log file is ., but this file can named manually when enabling.
Extension of this file is .DSC and this file is located in the directory /dirrpt PURGE and APPEND keywords are used in the process parameter files to manually maintain the Discard File. Similar to the Report file, the Discard file can also be rolled over using the keyword DISCARDFILEROLLOVER. The syntax is as below., file_name The relative or fully qualified name of the discard file, including the actual file name. APPEND Adds new content to existing content if the file already exists. PURGE Purges the file before writing new content. MAXBYTESn | MEGABYTESn File size in Bytes. For file size in bytes the valid range is from 1 to 2147483646. The default is 50000000. For file size in megabytes the valid range is from 1 to 2147. The default size is 50MB. If the specified size is exceeded, the process Abends. NODISCARDFILE When using this parameter, there will be no discard file creation. It prevents generating the Discard file. The below is the example for the Discard file parameter used in the Replicat process parameter file., The Discard File is mainly used in the Target Side. Each and Every Replicat Process should have its own Discard File. This is a mandatory one The below is the example which shows the contents of the Discard file. The Replicat process got Abended due to the error OCI Error ORA-01403 : no data found. The discard file is as below., So, we have seen about the three basic and important file where Oracle GoldenGate Processes logs the information. There is also a tool which is used to troubleshoot Oracle GoldenGate during Data corruption or trail file corruption. This is mainly used when Data error occurs in the Oracle GoldenGate. The tool is called LOGDUMP. It is a very useful tool which allows a user to navigate through the trail file and compare the information of the trail file with the data extracted and replicated by the processes. The below can be seen in the trail file using the LOGDUMP utility., Transactions Information Operation type and Time when the Record written. Source Object name Image type, whether it is a Before Image or After Image. Column information with data and sequence information. Record length, Record data in ASCII format. RBA Information. The below is the example of the contents of the Trail File., Some of the Logdump commands with the description are below., To get in to the logdump prompt, just run the logdump program from the Oracle GoldenGate Home directory. Logdump 1> GHDR ON – To view the Record Header. Logdump 2> DETAIL ON – To view the column information. Logdump 3> DETAIL DATA – To view the Hex and ASCII values of the Column. Logdump 4> USERTOKEN ON – User defined information specified in the Table of Map statements. These information are stored in the Trail file. Logdump 4> GGSTOKEN ON – Oracle GoldenGate generated tokens. These tokens contains the Transaction ID, Row ID etc., Logdump 5> RECLEN length – Manually control the length of the record. Logdump 6> OPEN file_name – To open a Trail file. Logdump 7> NEXT – To move to the next File record. In short, you can use the letter N. Logdump 8> POS rba – To position to a particular RBA. Logdump 9> POS FIRST – To go to the position of the first record in the file. Logdump 10> POS 0 – This is the alternate command for the POS FIRST. Either of this can be used. Logdump 11> SCANFORENDTRANS – To go to the end of the transaction. Logdump 12> HELP – To get the online help. Logdump 13> EXIT – To exit from the Logdump prompt. You can also use QUIT alternatively. Hope you got a clear view on how to approach to a Oracle GoldenGate problem and also find who stopped the Oracle GoldenGate process and the reason behind it.
REPLICAT PROCESS STATUS IS ABENDED
#if status is abending then go through this.
GGSCI (bld-qa-ts24) 4> info all
Program Status Group Lag at Chkpt Time Since Chkpt
MANAGER RUNNING
REPLICAT ABENDED REP1 00:00:00 00:00:03
########################################
GGSCI > view report rep1
2016-12-14 11:06:18 ERROR OGG-00519 Fatal error executing DDL replication: error [Error code [904],
ORA-00904: "NEW_COL": invalid identifier SQL ALTER TABLE testt1."BB" drop column new_col /*
GGSCI > edit params rep1
REPLICAT rep1
ASSUMETARGETDEFS
USERID ggate, PASSWORD ggate
gettruncates
DDL INCLUDE MAPPED
MAP test1.*, TARGET testt1.*;
############add this line ########
ddlerror 904 ignore ( DDLERROR ((Your error code) "ora-00904" in this case) ignore )
or Add
DDLERROR DEFAULT IGNORE RETRYOP
#Now your params should be like
REPLICAT rep1
ASSUMETARGETDEFS
USERID ggate, PASSWORD ggate
gettruncates
ddlerror 904 ignore
DDL INCLUDE MAPPED
MAP test1.*, TARGET testt1.*;
##### now Exit from editor #####
### Restart your replicat process ###
GGSCI > start rep1
Sending START request to MANAGER ...
REPLICAT REP1 starting
GGSCI > info all
Program Status Group Lag at Chkpt Time Since Chkpt
MANAGER RUNNING
REPLICAT RUNNING REP1 00:00:00 00:00:03
We have noticed as per our experience during training, there are some of the common queries/issues faced by trainees while they are supporting the Goldengate environment or setting up the new environment. Hence we have come up with a blog series on those common issues/questions and resolution. Here is the fourth Query:
Check here for the third query, replicat is running but not applying transactions? Get answer from here
Issue:
While trying to start goldengate extract or replicat processes, its getting abended
On Checking the ggserr.log file, found the below error
Note: ggserr.log in goldengate is present in Goldengate installation directory.
2018-08-03 12:33:54 ERROR OGG-02091 Oracle GoldenGate Delivery for Oracle, rep1.prm: Operation not supported because enable_goldengate_replication is not set to true.
2014-08-03 12:33:54 ERROR OGG-01668 Oracle GoldenGate Delivery for Oracle, rep1.prm: PROCESS ABENDING.
So let’s first understand role of this parameter ENABLE_GOLDENGATE_REPLICATION, it controls the services of Oracle Database for Oracle GoldenGate (both capture and apply services). On setting this to true enables the RDBMS services used by Oracle GoldenGate.
Supplemental Logging is controlled by this parameter. Supplemental logging is required for the logical replication of new data types and operations. Enabling supplemental logging add extra information to the redo log files so that changed vector is converted to SQL statements without having access to the database often. Earlier in GoldenGate, these added changes were controlled or handled by the Supplemental Logging DDL.
Introduction
By default, Oracle Golden Gate replicat processes ABEND when they encounter an error. The error is listed in the ggserr.log file. There are several ways how to handle these errors, as will be explained in this post.1 Find out where the replicat process abended
It is important to know what the replicat was working on when it abended. You can use the logdump utility to find out:First, check the current RBA with the info replicat statement:
GGSCI> info replicat rhr

REPLICAT   RHR    Last Started 2017-09-20 08:15   Status ABENDED
INTEGRATED
Checkpoint Lag       00:00:00 (updated 20:15:48 ago)
Log Read Checkpoint  File ./dirdat/prd12c/x1000000105
                     2017-09-19 12:04:18.011406  RBA 71587384
Then, open the logfile and navigate to that RBA:
Logdump 37 >open ./dirdat/prd12c/x1000000105
Current LogTrail is ./dirdat/prd12c/x1000000105
Logdump 38 >pos 71587384
Reading forward from RBA 71587384
Logdump 39 >n

2017/09/15 14:22:04.030.476 Insert               Len   126 RBA 71587384
Name: HR.GG_TBL_CUSTOM_HEARTBEAT_X1  (TDR Index: 3)
After  Image:                                             Partition 12   G  s
 0000 0009 0000 0005 3336 3032 3000 0100 0900 0000 | ........36020.......
 0547 5245 454e 0002 0015 0000 3230 3137 2d30 392d | .GREEN......2017-09-
 3135 3a31 343a 3232 3a30 3400 0300 15ff ff31 3930 | 15:14:22:04......190
 302d 3031 2d30 313a 3030 3a30 303a 3030 0004 0015 | 0-01-01:00:00:00....
 ffff 3139 3030 2d30 312d 3031 3a30 303a 3030 3a30 | ..1900-01-01:00:00:0
 3000 0500 15ff ff31 3930 302d 3031 2d30 313a 3030 | 0......1900-01-01:00
 3a30 303a 3030                                    | :00:00
2 Skip the transaction
The transaction that caused the error can be skipped. This is a bit tricky, since you don't know what else is part of the same transaction, but anyway:ggsci> start replicat rtest skiptransactionYou can see the event listed in the report file:
2017-09-05 11:21:19 INFO OGG-01370 User requested START SKIPTRANSACTION. The current transaction will be skipped. Transaction ID 42.18.335260, position Seqno 19, RBA 173843944.
3 Exclude the table from the replication
In case the table that causes the problems is not really needed, you can exclude it from the replication. Add the following to the Replicat parameter file and restart the replicat:ggsci> edit param r1hr --add the follwing MAPEXCLUDE HR.PROBLEM_TABLE; ggsci> start replicat r1hr
4 Use REPERROR to handle exceptions
Discrepancies caused by tables without keys
✔
Are there target tables that lack a primary key or unique constraints?
●
Without a primary key or unique constraint
s, Oracle GoldenGate uses all of the
columns as a key. Multiple rows could be
updated if they contain identical data.
●
Use the
KEYCOLS
option of
TA B L E
and
MAP
, or use
DBOPTIONS
with the
LIMITROWS
option to
prevent multiple rows from being updated (supported databases only)Oracle GG Golden Gate Replicat Process is Abended in UPDATE. What to check.
General
==========================
The issue: One of the Oracle GG (Golden Gate) REPLICAT processes is in ABENDED status
>%cd /software/ogg/1212
/software/ogg/1212/>% ./ggsci
info all
EXTRACT RUNNING EXT_S_01 00:00:07 00:00:06
EXTRACT RUNNING EXT_S_03 00:00:06 00:00:06
EXTRACT RUNNING EXT_S_04 00:00:05 00:00:09
EXTRACT RUNNING EXT_S_05 00:00:06 00:00:01
REPLICAT RUNNING REP_I_01 00:00:00 00:00:08
REPLICAT RUNNING REP_I_03 00:00:00 00:00:04
REPLICAT RUNNING REP_I_04 00:00:00 00:00:09
REPLICAT RUNNING REP_I_05 00:00:00 00:00:08
REPLICAT RUNNING REP_P_01 00:00:00 00:00:08
REPLICAT RUNNING REP_P_03 00:00:00 00:00:08
REPLICAT RUNNING REP_P_04 00:00:02 00:00:03
REPLICAT ABENDED REP_P_05 6208:22:23 00:44:39
REPLICAT RUNNING REP_P_06 00:00:00 00:00:08
REPLICAT RUNNING REP_S_01 00:00:00 00:00:03
REPLICAT RUNNING REP_S_03 00:00:00 00:00:01
REPLICAT RUNNING REP_S_04 00:00:00 00:00:00
==========================
Error
==========================
When checking error log for the Replicat process, there are these errors
2018-07-30 14:23:27 WARNING OGG-01004 Oracle GoldenGate Delivery for Oracle, rep_p_05.prm:
Aborted grouped transaction on 'BEL_BELGA_MOCOQ.GA_PRODUCT_TREE_CONF', Database error 1403 (OCI Error ORA-01403: no data found, SQL <UPDATE "BEL_BELGA_MOCOQ"."GA_PRODUCT_TREE_CONF" x SET x."ITEM_ID" = :a1 WHERE x."ITEM_ID" = :b0>).
2018-07-30 14:23:27 WARNING OGG-01154 Oracle GoldenGate Delivery for Oracle, rep_p_05.prm:
SQL error 1403 mapping BEL_BELGA_MOCOQ.GA_PRODUCT_TREE_CONF
to BEL_BELGA_MOCOQ.GA_PRODUCT_TREE_CONF OCI Error ORA-01403: no data found, SQL <UPDATE "BEL_BELGA_MOCOQ"."GA_PRODUCT_TREE_CONF" x SET x."ITEM_ID" = :a1 WHERE x."ITEM_ID" = :b0>.
2018-07-30 14:23:27 ERROR OGG-01296 Oracle GoldenGate Delivery for Oracle, rep_p_05.prm: Error mapping from BEL_BELGA_MOCOQ.GA_PRODUCT_TREE_CONF to BEL_BELGA_MOCOQ.GA_PRODUCT_TREE_CONF.
2018-07-30 14:23:27 ERROR OGG-01668 Oracle GoldenGate Delivery for Oracle, rep_p_05.prm: PROCESS ABENDING.
==========================
SKIPTRANSACTION
==========================
The syntax:
START REPLICAT <group_name> SKIPTRANSACTION
Maybe need to repeat this step several times, since several transactions should be skipped.
SKIPTRANSACTION causes Replicat to skip the first transaction after its expected startup position in the trail.
All operations from that first transaction are excluded.
If the MAXTRANSOPS parameter is also being used for this Replicat, it is possible that the process will start to read the trail file from somewhere in the middle of a transaction.
In that case, the remainder of the partial transaction is skipped, and Replicat resumes normal processing from the next begin-transaction record in the file.
The skipped records are written to the discard file if the DISCARDFILE parameter is being used;
Otherwise, a message is written to the report file that is similar to:
User requested START SKIPTRANSACTION.
The current transaction will be skipped.
Transaction ID txid, position Seqno seqno, RBA rba
==========================
Fix for error
==========================
The solution is to reset the Replicat Process on BOTH nodes.
REPLICAT altered
START REPLICAT REP_P_05
Sending START request to MANAGER ...
REPLICAT REP_P_05 starting
INFO ALL
EXTRACT RUNNING EXT_S_01 00:00:07 00:00:06
EXTRACT RUNNING EXT_S_03 00:00:06 00:00:06
EXTRACT RUNNING EXT_S_04 00:00:05 00:00:09
EXTRACT RUNNING EXT_S_05 00:00:06 00:00:01
REPLICAT RUNNING REP_I_01 00:00:00 00:00:08
REPLICAT RUNNING REP_I_03 00:00:00 00:00:04
REPLICAT RUNNING REP_I_04 00:00:00 00:00:09
REPLICAT RUNNING REP_I_05 00:00:00 00:00:08
REPLICAT RUNNING REP_P_01 00:00:00 00:00:08
REPLICAT RUNNING REP_P_03 00:00:00 00:00:08
REPLICAT RUNNING REP_P_04 00:00:09 00:00:04
REPLICAT RUNNING REP_P_05 00:00:00 00:00:08
REPLICAT RUNNING REP_S_01 00:00:00 00:00:03
REPLICAT RUNNING REP_S_03 00:00:00 00:00:01
REPLICAT RUNNING REP_S_04 00:00:00 00:00:00
REPLICAT RUNNING REP_S_05 00:00:00 00:00:04
==========================
Deep Fix for error
==========================
Need to add SCHEMATRANDATA or TRANDATA on the mapping schemas.
ADD SCHEMATRANDATA <schema_name>
ADD TRANDATA <schema_name>.*
If possible, use the ADD SCHEMATRANDATA command rather than the ADD TRANDATA command.
The ADD SCHEMATRANDATA command ensures replication continuity should DML occur on an object for which DDL has just been performed.
ADD SCHEMATRANDATA
Example:
DBLOGIN...
ADD SCHEMATRANDATA scott
Use ADD SCHEMATRANDATA to enable schema-level supplemental logging for a table.
ADD SCHEMATRANDATA acts on all of the current and future tables in a given schema to automatically log a superset of available keys that Oracle GoldenGate needs for row identification.
ADD SCHEMATRANDATA is valid for both integrated and classic capture and does the following:
- Enables Oracle supplemental logging for new tables created with a CREATE TABLE.
- Updates supplemental logging for tables affected by an ALTER TABLE to add or drop columns.
- Updates supplemental logging for tables that are renamed.
- Updates supplemental logging for tables for which unique or primary keys are added or dropped.
ADD SCHEMATRANDATA is not straight forward:
1. Need to apply Oracle Patch 10423000 to the source database if the Oracle version is earlier than 11.2.0.2.
2. Oracle strongly encourages putting the source database into forced logging mode and enabling minimal supplemental logging at the database level when using Oracle GoldenGate.
ADD TRANDATA
Example:
DBLOGIN...
ADD TRANDATA scott.my_table
Use ADD TRANDATA to enable Oracle GoldenGate to acquire the transaction information that it needs from the transaction records.
By default, ADD TRANDATA for
Oracle enables the unconditional logging of the primary key and the
conditional supplemental logging of all unique key(s) and foreign key(s)
of the specified table.
If possible, use the ADD SCHEMATRANDATA command rather than the ADD TRANDATA command.
The ADD SCHEMATRANDATA command ensures replication continuity should DML occur on an object for which DDL has just been performed.
==========================
Alternative Fix for error
==========================
Another solution, which I did not test myself, would be to follow Oracle TechNote:
"Replicat Abends with "OGG-01154 SQL error 1403 mapping" (Doc ID 1329189.1)"Symptoms
Replicat abending with the below error:
2011-05-31 22:42:22 WARNING OGG-01004 Aborted grouped transaction on 'STG_SAP.HRP1000', Database error 100 (retrieving bind info for query).
2011-05-31 22:42:22 WARNING OGG-01003 Repositioning to rba 21070779 in seqno 15.
2011-05-31 22:42:22 WARNING OGG-01154 SQL error 1403 mapping SAPSR3.HRP1000 to STG_SAP.HRP1000.
2011-05-31 22:42:22 WARNING OGG-01003 Repositioning to rba 21070779 in seqno 15.
Cause
The cause is not entirely identified
Solution
Deleted trandata for all the tables and add them again
GGSCI (Sapzax04) 1> DBLOGIN USERID GGSUSER PASSWORD ****
GGSCI (Sapzax04) 2> DELETE TRANDATA XXXX.YYYY
GGSCI (Sapzax04) 2> ADD TRANDATA XXXX.YYYY
What type of Topology does Oracle Goldengate support?
GoldenGate supports the following topologies. More details can be found here.- Unidirectional
- Bidirectional
- Peer-to-peer
- Broadcast
- Consolidation
- Cascasding
What are the main components of the Oracle Goldengate replication?
The replication configuration consists of the following processes.- Manager
- Extract
- Pump
- Replicate
What database does Oracle GoldenGate support for replication?
- Oracle Database
- TimesTen
- MySQL
- IBM DB2
- Microsoft SQL Server
- Informix
- Teradata
- Sybase
- Enscribe
- SQL/MX
What transaction types does Oracle Goldengate support for Replication?
Goldengate supports both DML and DDL Replication from the source to target.What are the supplemental logging pre-requisites?
The following supplemental logging is required.- Database supplemental logging
- Object level logging
Why is Supplemental logging required for Replication?
When a transaction is committed on the source database, only new data is written to the Redo log. However for Oracle to apply these transactions on the destination database, the before image key values are required to identify the effected rows. This data is also placed in the trail file and used to identify the rows on the destination, using the key value the transactions are executed against them.List important considerations for bi-directional replication?
The customer should consider the following points in an active-active replication environment.- Primary Key: Helps to identify conflicts and Resolve them.
- Sequences: Are not supported. The work around is use to use odd/even, range or concatenate sequences.
- Triggers: These should be disabled or suppressed to avoid using uniqueness issue
- Data Looping: This can easy avoided using OGG itself
- LAG: This should be minimized. If a customer says that there will not be any LAG due to network or huge load, then we don’t need to deploy CRDs. But this is not the case always as there would be some LAG and these can cause Conflicts.
- CDR (Conflict Detection & Resolution): OGG has built in CDRs for all kind of DMLs that can be used to detect and resolve them.
- Packaged Application: These are not supported as it may contain data types which are not support by OGG or it might not allow the application modification to work with OGG.
Are OGG binaries supported on ASM Cluster File System (ACFS)?
Yes, you can install and configure OGG on ACFS.Are OGG binaries supported on the Database File System (DBFS)? What files can be stored in DBFS?
No, OGG binaries are not supported on DBFS. You can however store parameter files, data files (trail files), and checkpoint files on DBFS.What is the default location of the GLOBALS file?
A GLOBALS file is located under Oracle GoldenGate installation directory (OGG HOME)Where can filtering of data for a column be configured?
Filtering of the columns of a table can be set at the Extract, Pump or Replicat level.Is it a requirement to configure a PUMP extract process in OGG replication?
A PUMP extract is an option, but it is highly recommended to use this to safe guard against network failures. Normally it is configured when you are setting up OGG replication across the network.What are the differences between the Classic and integrated Capture?
Classic Capture:- The Classic Capture mode is the traditional Extract process that accesses the database redo logs (optionally archive logs) to capture the DML changes occurring on the objects specified in the parameter files.
- At the OS level, the GoldenGate user must be a part of the same database group which owns the database redo logs.
- This capture mode is available for other RDBMS as well.
- There are some data types that are not supported in Classic Capture mode.
- Classic capture can’t read data from the compressed tables/tablespaces.
- In the Integrated Capture mode, GoldenGate works directly with the database log mining server to receive the data changes in the form of logical change records (LCRs).
- IC mode does not require any special setup for the databases using ASM, transparent data encryption, or Oracle RAC.
- This feature is only available for oracle databases in Version 11.2.0.3 or higher.
- It also supports various object types which were previously not supported by Classic Capture.
- This Capture mode supports extracting data from source databases using compression.
- Integrated Capture can be configured in an online or downstream mode.
List the minimum parameters that can be used to create the extract process?
The following are the minimium required parameters which must be defined in the extract parameter file.- EXTRACT NAME
- USERID
- EXTTRAIL
- TABLE
What are macros?
Macro is an easier way to build your parameter file. Once a macro is
written it can be called from different parameter files. Common
parameters like username/password and other parameters can be included
in these macros. A macro can either be another parameter file or a
library.
Where can macros be invoked?
The macros can be called from the following parameter files.- Manager
- Extract
- Replicat
- Gobals
How is a macro defined?
A macro statement consists of the following.- Name of the Macro
- Parameter list
- Macro body
MACRO #macro_name
PARAMS (#param1, #param2, …)
BEGIN
< macro_body >
END;
I want to configure multiple extracts to write to the same exttrail file? Is this possible?
Only one Extract process can write to one exttrail at a time. So you can’t configure multiple extracts to write to the same exttrail.What type of Encryption is supported in Oracle Goldengate?
Oracle Goldengate provides 3 types of Encryption.- Data Encryption using Blow fish.
- Password Encryption.
- Network Encryption.
What are the different password encrytion options available with OGG?
You can encrypt a password in OGG using- Blowfish algorithm and
- Advance Encryption Standard (AES) algorithm
What are the different encryption levels in AES?
You can encrypt the password/data using the AES in three different keysa) 128 bit
b) 192 bit and
c) 256 bit
Is there a way to check the syntax of the commands in the parameter file without actually running the GoldenGate process
Yes, you can place the SHOWSYNTAX parameter in the parameter file and try starting. If there is any error you will see it.How can you increase the maximum size of the read operation into the buffer that holds the results of the reads from the transaction log?
If you are using the Classical Extract you may use the TRANSLOGOPTION ASMBUFSIZE parameter to control the read size for ASM Databases.What information can you expect when there us data in the discard file?
When data is discarded, the discard file can contain:1. Discard row details
2. Database Errors
3. Trail file number
What command can be used to switch writing the trail data to a new trail file?
You can use the following command to write the trail data to a new trail file.SEND EXTRACT ext_name, ROLLOVER
How can you determine if the parameters for a process was recently changed
When ever a process is started, the parameters in the .prm file for the process is written to the process REPORT. You can look at the older process reports to view the parameters which were used to start up the process. By comparing the older and the current reports you can identify the changes in the parameters.How to Handle Tables Without Primary Keys or Unique Indexes With Oracle GoldenGate
In order to maintain data integrity when replicating transactional data, Oracle GoldenGate will use primary key columns or unique index columns to uniquely identify a row when issuing update or delete statements against the target database. If no primary keys or unique indexes exist on the table being replicated, Oracle GoldenGate will use all columns to uniquely identify a row.It is perfectly acceptable to use all columns to uniquely identify a row under the following conditions:
- A logical key column cannot be defined for the table using the KEYCOLS parameter.
- No duplicate rows exist in the table
- Table contains a small number of rows, so full table lookups on the target database are minimal
- Table DML activity is very low, so “all column” table supplemental log groups do not negatively impact the source database redo logs
-----------------------Standby--------------
Comparative
study of Standby database from 7.3 to latest version
12c
Data Guard Agenda
-
Physical Standby
-
Logical Standby
-
Snapshot Standby
-
Active Data Guard
-
Data Guard Broker
-
Architecture
-
Configurations
-
Standby Creations using Commands and OEM
-
12c NFs (Far Sync, Fast Sync, etc.)
-
Far Sync Lab
-
Data Protection Modes
-
Role Transitions
-
Flashback Database
-
Fast-Start Failover (Observer Software)
-
Backup and Recovery in DG
-
Patching
-
Optimization DG
High
Availability Solutions from Oracle
-
RAC
-
RAC ONE Node
-
Data Guard
-
Golden Gate
-
Oracle Streams
History
Version
7.3
-
keeping duplicate DB in a separate server
-
can be synchronized with Primary Database
-
was constantly in Recovery Mode
-
NOT able to automate the transfer of Archive Redo Logs
and
Apply
-
DBAs has to find an option for transfer of Archive
Redo
Logs and Apply
-
aim was disaster recovery
Version
8i
-
Archive log shipping and apply process automatic
-
which is now called
-
managed standby environment (log shipping)
-
managed recovery (apply process)
-
was not possible to set a DELAY in the managed recovery mode
-
possible to open a Standby with read-only mode
for
reporting purpose
-
when we added a Data File or Created TS on Primary,
these
changes were NOT being replicated to STandby
-
when we opened the Primary with resetlogs
or
restored a backup control file,
we
had to re-create the Standby
Version
9i
-
Oracle 8i Standby was renamed to Oracle 9i Data Guard
-
introduced Data Guard Broker
-
ZERO Data Loss on Failover was guaranteed
-
Switchover as introduced (primary <> standby)
-
Gap resolution (missing logs detected
and
trasmits automatically)
-
DELAY option was added
-
parallel recovery increase recovery performance on STandby
-
Logical Standby was introduced
Version
10g
-
Real-Time Apply (provides faster swithover and failover)
-
Flashback Database support was introduced
-
if we open a Primary with resetlogs,
it
was NOT required to re-create the Standby
-
Standby was able to recover through resetlogs
-
Rolling Upgrades of Primary Database
-
Fast-Start-Failover (Observer Software)
Version
11g
-
Active Data Guard
-
Snapshot Standby (possible with 10g R2
guaranteed
restore point)
-
continuous archived log shipping with snapshot standby
-
compress REDO when resolving Gaps => 11g R1
-
compress of all REDO => 11g R2
-
possible to include different O/S in DataGuard
-
recovery of Block corruptions automatic
for
Active Data Guard
-
"Block Change Tracking" can be run on Active Data Guard
Version
12c
-
Far Sync
-
Fast Sync
-
Session Sequence
-
temp as UNDO
-
Rolling Upgrade using PL/SQL Package (DBMS_Rolling)
LNS=Log
Writer Network Server
RFS=Remote
File Server
MRP=Managed
Recovery
LSP=Logical
STandby
DMON=Data
Guard Broker Monitor Process
NSS
= Network Server SYNC
MRP
= coordinates read and apply process of REDO on Physical Standby
RFS
= responsible for receiving the REDO Data,
which
is sent by the Primary to STandby
LGWR
and SYNC
-
REDO is read and sent to the STandby directly
from
the log buffer by the LNS process
-
Ack. needed from the standby (RFS to LNS
and
LNS to LGWR)
to
send COMMIT Ack to the Database USer
LGWR
and ASYNC
-
NO ack needed from standby to send the COMMIT ack.
to
Prmary Database
-
redo is read and sent to standby from redo log buffer
or
online redo logs by the LNS process
-
redo log buffer before it is recycled,
it
automatically reads and sends redo data
from
online redo
-
the committed transactions that weren't shipped
to
standby yet, may be lost in a Failover
FAL_CLIENT
-
no longer required from 11g R2
-
primary DB will obtain the Client Service Name
from
the related LOG_ARCHIVE_DEST_n
How
to start REDO Apply as Foreground Process?
alter
database recover managed standby database;
How
to start REDO Apply as Background Process?
use
DISCONNECT FROM SESSION option,
alter
database recover managed standby database
disconnect
from session;
How
to cancel REDO Apply?
alter
database recover managed standby database cancel;
I
found this... check "4.7.10.1 Data Guard Status" in
http://docs.oracle.com/cd/E11857_01/em.111/e16285/oracle_database.htm#CHDBEAFG
Today we will demonstrate recovery of standby database with SCN based incremental backup in environment where we have shared filesystem on primary site while standby database is hosting files in ASM.
-
Check the minimum SCN on standby database from where the changes need to be applied.Standby Site
SQL> select min (checkpoint_change#) from v$datafile_header order by 1;
MIN(CHECKPOINT_CHANGE#)
———————–
109182027
-
Stop log shipping from Primary to standby as we need to stop standby database during this activity.Primary Site
SQL> alter system set log_archive_dest_state_2=defer scope=both;
-
Take SCN based backup with SCN number we have note down from step 1.Primary Site
rman target /
RMAN> BACKUP INCREMENTAL FROM SCN 109182027 DATABASE FORMAT ‘/backup/backup4stby_%U’ tag ‘4STANDBY’; -
SCP the backup pieces to the standby host
-
Catalog backup pieces to standby site.Catalog the backup pieces to standby control file.
Standby Site
MASKSTBY1 % rman target /
Recovery Manager: Release 11.2.0.3.0 – Production on Wed Apr 30 22:10:15 2014
Copyright (c) 1982, 2011, Oracle and/or its affiliates. All rights reserved.
connected to target database: MASKPRMY (DBID=1365341345, not open)
RMAN>catalog start with ‘/u02/backups/MASKSTBY’;
using target database control file instead of recovery catalog
searching for all files that match the pattern /u02/backups/MASKSTBY
List of Files Unknown to the Database
=====================================
File Name: /u02/backups/MASKSTBY/ForStandby_02p72dts_1_1
File Name: /u02/backups/MASKSTBY/ForStandby_01p72dfs_1_1
Do you really want to catalog the above files (enter YES or NO)? YES
cataloging files…
cataloging done
List of Cataloged Files
=======================
File Name: /u02/backups/MASKSTBY/ForStandby_02p72dts_1_1
File Name: /u02/backups/MASKSTBY/ForStandby_01p72dfs_1_1
RMAN> exit -
Cancel the managed recovery at the standby host and recover standby with backupStandby Site
SQL> alter database recover managed standby database cancel;
RMAN> recover database noredo;
Starting recover at 30-APR-2014 22:12:02
allocated channel: ORA_DISK_1
channel ORA_DISK_1: SID=591 instance=MASKSTBY1 device type=DISK
channel ORA_DISK_1: starting incremental datafile backup set restore
channel ORA_DISK_1: specifying datafile(s) to restore from backup set
destination for restore of datafile 00001: +DATA/MASKSTBY/datafile/system.677.810819327
destination for restore of datafile 00002: +DATA/MASKSTBY/datafile/sysaux.678.810819327
destination for restore of datafile 00003: +DATA/MASKSTBY/datafile/undotbs1.679.810819327
destination for restore of datafile 00004: +DATA/MASKSTBY/datafile/users.680.810819327
destination for restore of datafile 00005: +DATA/MASKSTBY/datafile/undotbs2.681.810819329
destination for restore of datafile 00006: +DATA/MASKSTBY/datafile/custom_apps_data.682.810819331
destination for restore of datafile 00007: +DATA/MASKSTBY/datafile/custom_apps_idx.683.810819331
channel ORA_DISK_1: reading from backup piece /u02/backups/MASKSTBY/ForStandby_01p72dfs_1_1
channel ORA_DISK_1: piece handle=/u02/backups/MASKSTBY/ForStandby_01p72dfs_1_1 tag=STANDBY
channel ORA_DISK_1: restored backup piece 1
channel ORA_DISK_1: restore complete, elapsed time: 00:00:07
Finished recover at 30-APR-2014 22:12:10
RMAN> exit
-
Take the backup of the control file as standby at the primary site using RMAN.Primary Site
SQL> BACKUP CURRENT CONTROLFILE FOR STANDBY tag standbycrtl format ‘/tmp/control_standby.ctl’;
-
List database location from standby database as primary and standby sites have different file structure.Standby Site
RMAN> report schema;
List of Permanent Datafiles
===========================
File Size(MB) Tablespace RB segs Datafile Name
—- ——– ——————– ——- ————————
1 1050 SYSTEM *** +DATA/MASKSTBY/datafile/system.677.810819327
2 1600 SYSAUX *** +DATA/MASKSTBY/datafile/sysaux.678.810819327
3 105 UNDOTBS1 *** +DATA/MASKSTBY/datafile/undotbs1.679.810819327
4 5 USERS *** +DATA/MASKSTBY/datafile/users.680.810819327
5 487 UNDOTBS2 *** +DATA/MASKSTBY/datafile/undotbs2.681.810819329
6 10240 CUSTOM_APPS_DATA *** +DATA/MASKSTBY/datafile/custom_apps_data.682.810819331
7 4096 CUSTOM_APPS_IDX *** +DATA/MASKSTBY/datafile/custom_apps_idx.683.810819331
List of Temporary Files
=======================
File Size(MB) Tablespace Maxsize(MB) Tempfile Name
—- ——– ——————– ———– ——————–
1 20 TEMP 32767 +DATA/MASKSTBY/tempfile/temp.701.812135229
-
SCP the standby control file to the standby host and restore control file on standby database.Standby Site
RMAN> shutdown immediate;
RMAN> startup nomount;
RMAN> RESTORE STANDBY CONTROLFILE FROM ‘/u02/backups/MASKSTBY/stby_control.ctl’;
Starting restore at 01-MAY-2014 03:54:41
using target database control file instead of recovery catalog
allocated channel: ORA_DISK_1
channel ORA_DISK_1: SID=1 instance=MASKSTBY1 device type=DISK
channel ORA_DISK_1: restoring control file
channel ORA_DISK_1: restore complete, elapsed time: 00:00:05
output file name=+DATA/MASKSTBY/controlfile/current.676.810818661
output file name=+FRA/MASKSTBY/controlfile/current.15472.810818661
Finished restore at 01-MAY-2014 03:54:46
-
Check physical structure of database by querying control file, it will report structure of primary, which need to be changed.Standby Site
SQL> alter database mount;
Database altered.RMAN> report schema;
RMAN-06139: WARNING: control file is not current for REPORT SCHEMA
Report of database schema for database with db_unique_name MASKPRMY
List of Permanent Datafiles
===========================
File Size(MB) Tablespace RB segs Datafile Name
—- ——– ——————– ——- ————————
1 0 SYSTEM *** /u287/oradata/MASKPRMY/system01.dbf
2 0 SYSAUX *** /u287/oradata/MASKPRMY/sysaux01.dbf
3 0 UNDOTBS1 *** /u287/oradata/MASKPRMY/undotbs01.dbf
4 0 USERS *** /u287/oradata/MASKPRMY/users01.dbf
5 0 UNDOTBS2 *** /u287/oradata/MASKPRMY/undotbs02.dbf
6 0 CUSTOM_APPS_DATA *** /u287/oradata/MASKPRMY/CUSTOM_APPS_DATA.dbf
7 0 CUSTOM_APPS_IDX *** /u287/oradata/MASKPRMY/CUSTOM_APPS_IDX.dbf
List of Temporary Files
=======================
File Size(MB) Tablespace Maxsize(MB) Tempfile Name
—- ——– ——————– ———– ——————–
1 20 TEMP 32767 /u287/oradata/MASKPRMY/temp01.dbf
-
Rename the file references in controlfile.Standby Site
Note: we tried “alter database rename file” and got following error as there is no file which we try to rename only file available is in ASM.
SQL> alter database rename file ‘/u287/oradata/MASKPRMY/system01.dbf’ to ‘+DATA/MASKSTBY/datafile/system.677.810819327’;
ERROR at line 1:
ORA-01511: error in renaming log/data files
ORA-01516: nonexistent log file, data file, or temporary file
“/u287/oradata/MASKPRMY/system01.dbf”
If we use RMAN then it will be done without any issue.
RMAN> run
{
set newname for datafile 1 to ‘+DATA/MASKSTBY/datafile/system.677.810819327’;
set newname for datafile 2 to ‘+DATA/MASKSTBY/datafile/sysaux.678.810819327’;
set newname for datafile 3 to ‘+DATA/MASKSTBY/datafile/undotbs1.679.810819327’;
set newname for datafile 4 to ‘+DATA/MASKSTBY/datafile/users.680.810819327’;
set newname for datafile 5 to ‘+DATA/MASKSTBY/datafile/undotbs2.681.810819329’;
set newname for datafile 6 to ‘+DATA/MASKSTBY/datafile/custom_apps_data.682.810819331’;
set newname for datafile 7 to ‘+DATA/MASKSTBY/datafile/custom_apps_idx.683.810819331’;
switch datafile all;
}
executing command: SET NEWNAME
executing command: SET NEWNAME
executing command: SET NEWNAME
executing command: SET NEWNAME
executing command: SET NEWNAME
executing command: SET NEWNAME
executing command: SET NEWNAME
datafile 1 switched to datafile copy
input datafile copy RECID=469 STAMP=846389340 file name=+DATA/MASKSTBY/datafile/system.677.810819327
datafile 2 switched to datafile copy
input datafile copy RECID=470 STAMP=846389340 file name=+DATA/MASKSTBY/datafile/sysaux.678.810819327
datafile 3 switched to datafile copy
input datafile copy RECID=471 STAMP=846389340 file name=+DATA/MASKSTBY/datafile/undotbs1.679.810819327
datafile 4 switched to datafile copy
input datafile copy RECID=472 STAMP=846389340 file name=+DATA/MASKSTBY/datafile/users.680.810819327
datafile 5 switched to datafile copy
input datafile copy RECID=473 STAMP=846389340 file name=+DATA/MASKSTBY/datafile/undotbs2.681.810819329
datafile 6 switched to datafile copy
input datafile copy RECID=474 STAMP=846389340 file name=+DATA/MASKSTBY/datafile/custom_apps_data.682.810819331
datafile 7 switched to datafile copy
input datafile copy RECID=475 STAMP=846389341 file name=+DATA/MASKSTBY/datafile/custom_apps_idx.683.810819331
RMAN> run
{
set newname for tempfile 1 to ‘+DATA/MASKSTBY/tempfile/temp.701.812135229’;
switch tempfile all;
}
executing command: SET NEWNAME
renamed tempfile 1 to +DATA/MASKSTBY/tempfile/temp.701.812135229 in control file
Check the references again:
RMAN> report schema;
RMAN-06139: WARNING: control file is not current for REPORT SCHEMA
Report of database schema for database with db_unique_name MASKSTBY
List of Permanent Datafiles
===========================
File Size(MB) Tablespace RB segs Datafile Name
—- ——– ——————– ——- ————————
1 1050 SYSTEM *** +DATA/MASKSTBY/datafile/system.677.810819327
2 1600 SYSAUX *** +DATA/MASKSTBY/datafile/sysaux.678.810819327
3 105 UNDOTBS1 *** +DATA/MASKSTBY/datafile/undotbs1.679.810819327
4 5 USERS *** +DATA/MASKSTBY/datafile/users.680.810819327
5 487 UNDOTBS2 *** +DATA/MASKSTBY/datafile/undotbs2.681.810819329
6 10240 CUSTOM_APPS_DATA *** +DATA/MASKSTBY/datafile/custom_apps_data.682.810819331
7 4096 CUSTOM_APPS_IDX *** +DATA/MASKSTBY/datafile/custom_apps_idx.683.810819331
List of Temporary Files
=======================
File Size(MB) Tablespace Maxsize(MB) Tempfile Name
—- ——– ——————– ———– ——————–
1 20 TEMP 32767 +DATA/MASKSTBY/tempfile/temp.701.812135229 -
Start shipping from primary and restart media recovery on standby site.Primary Site
Enable redo shipping from primary to standby
SQL> alter system set log_archive_dest_state_2=enable scope=both;
System altered.
Standby Site
Stop and restart media recovery
SQL> alter database recover managed standby database cancel;
Database altered.
SQL> alter database recover managed standby database using current logfile disconnect from session;
Database altered.
SQL> select inst_id,process,thread#,sequence#,blocks,status from gv$managed_standby where process like ‘%MRP%’;
INST_ID PROCESS THREAD# SEQUENCE# BLOCKS STATUS
———- ——— ———- ———- ———- ————
1 MRP0 1 319 1024000 APPLYING_LOG
SRL – standby redo log
How
to Standby apply process
in
the system above, SRLs are not configured on the standby database.
The arrows show how redo transport flows through the system. Redo
travels along this path:
A
transaction writes redo records into the Log Buffer in the System
Global Area (SGA).
-
The Log Writer process (LGWR) writes redo records from the Log Buffer to the Online Redo Logs (ORLs).
-
When the ORL switches to the next log sequence (normally when the ORL fills up), the Archiver process (ARC0) will copy the ORL to the Archived Redo Log.
-
Because a standby database exists, a second Archiver process (ARC1) will read from a completed Archived Redo Log and transmit the redo over the network to the Remote File Server (RFS) process running for the standby instance.
-
RFS sends the redo stream to the local Archiver process (ARCn).
-
ARCn then writes the redo to the archived redo log location on the standby server.
-
Once the archived redo log is completed, the Managed Recovery Process (MRP0) sends the redo to the standby instance for applying the transaction.
With
SRLs, not only do we have more items in the picture, we also have
different choices, i.e. different paths to get from the primary to
the standby. The first choice is to decide if we are configured for
Max Protect or Max Performance as I will discuss its impact below.
-
Just like without SRLs, a transaction generates redo in the Log Buffer in the SGA.
-
The LGWR process writes the redo to the ORL.
-
Are we in Max Protect or Max Performance mode?
-
If Max Protect, then we are performing SYNC redo transport. The Network Server SYNC process (NSSn) is a slave process to LGWR. It ships redo to the RFS process on the standby server.
-
If Max Performance mode, then we are performing ASYNC redo transport. The Network Server ASYNC process (NSAn) reads from the ORL and transports the redo to the RFS process on the standby server.
-
-
RFS on the standby server simply writes the redo stream directly to the SRLs.
-
How the redo gets applied depends if we are using Real Time Apply or not.
-
If we are using Real Time Apply, MRP0 will read directly from the SRLs and apply the redo to the standby database.
-
If we are not using Real Time Apply, MRP0 will wait for the SRL’s contents to be archived and then once archived and once the defined delay has elapsed, MRP0 will apply the redo to the standby database.
-
Best Practices
I’ve
already covered a few best practices concerning SRLs. I’ll recap
what I have already covered and include a few more in this section.
-
Make sure your ORL groups all have the same exact size. You want every byte in the ORL to have a place in its corresponding SRL.
-
Create the SRLs with the same exact byte size as the ORL groups. If they can’t be the same exact size, make sure they are bigger than the ORLs.
-
Do not assign the SRLs to any specific thread. That way, the SRLs can be used by any thread, even with Oracle RAC primary databases.
-
When you create SRLs in the standby, create SRLs in the primary. They will normally never be used. But one day you may perform a switchover operation. When you do switchover, you want the old primary, now a standby database, to have SRLs. Create them at the same time.
-
For an Oracle RAC primary database, create the number of SRLs equal to the number of ORLs in all primary instances. For example, if you have a 3-node RAC database with 4 ORLs in each thread, create 12 SRLs (3x4) in your standby. No matter how many instances are in your standby, the standby needs enough SRLs to support all ORLs in the primary, for all instances
-
DB_NAME – both the primary and the physical standby database will have the same database name. After all, the standby is an exact copy of the primary and its name needs to be the same.
-
DB_UNIQUE_NAME – While both the primary and the standby have the same database name, they have a unique name. In the primary, DB_UNIQUE_NAME equals DB_NAME. In the standby, DB_UNIQUE_NAME does not equal DB_NAME. The DB_UNIQUE_NAME will match the ORACLE_SID for that environment.
-
LOG_ARCHIVE_FORMAT – Because we have to turn on archive logging, we need to specify the file format of the archived redo logs.
-
LOG_ARCHIVE_DEST_1 – The location on the primary where the ORLs are archived. This is called the archive log destination.
-
LOG_ARCHIVE_DEST_2 – The location of the standby database.
-
REMOTE_LOGIN_PASSWORDFILE – We need a password file because the primary will sign on to the standby remotely as SYSDBA.
Create
the Standby Database
This
is the second major task to complete. In this section, we will create
a backup of the primary and use it to create the standby database. We
need to create a special standby control file. A password file, a
parameter file, and a similar TNS alias will complete the setup. The
subtasks are outlined below.
-
Create a backup of the primary.
-
Create a standby controlfile.
-
Copy the password file.
-
Create a parameter file.
-
Create a TNSNAMES.ORA file.
How to Speed up and Troubleshooting MRP (Log Apply Rate of a Standby Database) Stuck Issues
To
Speed up MRP on Standby database, Check for
1) parallel_execution_message_size - this is an OS dependent parameter
2) recovery_parallelism - this will be dictated by the numbers of CPU's and your ability to handle IO
3)
Consider increasing sga_target parameter, if it's set to low.
4)
Check for Disk I/O. Move you I/O intensive files to faster disks
including Online Redo log and Standby redo log files.
Dataguard Performance
The
following information is important about Physical Data Guard Redo
Apply performance:
11g
Media Recovery performance improvements include:
•More
parallelism by default
•More
efficient asynchronous redo read, parse, and apply
•Fewer
synchronization points in the parallel apply algorithm
•The
media recovery checkpoint at a redo log boundary no longer blocks the
apply of the next log
In
11g, when tuning redo apply consider following:
•By
default recovery parallelism = CPU Count-1. Do not use any other
values.
•Keep
PARALLEL_EXECUTION_MESSAGE_SIZE >= 8192
•Keep
DB_CACHE_SIZE >= Primary value
•Keep
DB_BLOCK_CHECKING = FALSE (if you have to)
•System
Resources Needs to be assessed
•Query
what MRP process is waiting
select a.event, a.wait_time, a.seconds_in_wait from gv$session_wait a, gv$session b where a.sid=b.sid and b.sid=(select SID from v$session where PADDR=(select PADDR from v$bgprocess where NAME='MRP0'))
When
tuning redo transport service, consider following:
1
- Tune LOG_ARCHIVE_MAX_PROCESSES parameter on the primary.
•Specifies
the parallelism of redo transport
•Default
value is 2 in 10g, 4 in 11g
•Increase
if there is high redo generation rate and/or multiple standbys
•Must
be increased up to 30 in some cases.
•Significantly
increases redo transport rate.
2
- Consider using Redo Transport Compression:
•In
11.2.0.2 redo transport compression can be always on
•Use
if network bandwidth is insufficient
•and
CPU power is available
Also
consider:
3
- Configuring TCP Send / Receive Buffer Sizes (RECV_BUF_SIZE /
SEND_BUF_SIZE)
4
- Increasing SDU Size
5
- Setting TCP.NODELAY to YES
-------------------------------------------------------------------
Original
Post:
Problem:
Recovery service has stopped for a while and there has been a gap
between primary and standby side. After recovery process was started
again, standby side is not able to catch primary side because of low
log applying performance. Disk I/O and memory utilization on standby
server are nearly 100%.
Solution:
1 – Rebooting the standby server reduced memory utilization a little.
2
– ALTER DATABASE RECOVER MANAGED STANDBY
DATABASE PARALLEL 8
DISCONNECT FROM SESSION;
In
general, using the parallel recovery option is most effective at
reducing recovery time when several datafiles on several different
disks are being recovered concurrently. The performance improvement
from the parallel recovery option is also dependent upon whether the
operating system supports asynchronous I/O. If asynchronous I/O is
not supported, the parallel recovery option can dramatically reduce
recovery time. If asynchronous I/O is supported, the recovery time
may be only slightly reduced by using parallel recovery.
3
– SQL>alter system Set
PARALLEL_EXECUTION_MESSAGE_SIZE = 4096 scope = spfile;
Set
PARALLEL_EXECUTION_MESSAGE_SIZE = 4096
When
using parallel media recovery or parallel standby recovery,
increasing the PARALLEL_EXECUTION_MESSAGE_SIZE database parameter to
4K (4096) can improve parallel recovery by as much as 20 percent. Set
this parameter on both the primary and standby databases in
preparation for switchover operations. Increasing this parameter
requires more memory from the shared pool by each parallel execution
slave process.
4
– Kernel parameters that changed in order to reduce file system
cache size.
dbc_max_pct
10 10 Immed
dbc_min_pct
3 3 Immed
5
– For secure path (HP) load balancing, SQL Shortest Queue Length is
chosen.
autopath
set -l 6005-08B4-0007-4D25-0000-D000-025F-0000 -b SQL
| Oracle 12c multiple physical standby setup and consideration |
I
have a question regarding having multiple physical standby DBs at the
same time (redo apply/log shipping) in the same server, is it
possible ? if so what would be the DB_NAME for my second
stand-by based on the values of the parameters below?
Primary
*.DB_NAME=CHICAGO
*.db_unique_name='CHICAGO'
*.log_archive_config='DG_CONFIG=(CHICAGO,
BOSTON, TORONTO)'
*.log_archive_dest_1='location=/adjarch/CHICAGO
reopen=60'
*.log_archive_dest_2='SERVICE=BOSTON
NOAFFIRM ASYNC VALID_FOR=(ONLINE_LOGFILES,PRIMARY_ROLE)
DB_UNIQUE_NAME=BOSTON'
*.log_archive_dest_3='SERVICE=TORONTO
NOAFFIRM ASYNC VALID_FOR=(ONLINE_LOGFILES,PRIMARY_ROLE)
DB_UNIQUE_NAME=TORONTO'
*.log_archive_dest_state_2='DEFER'
*.log_archive_dest_state_3='DEFER'
*.log_archive_format='archCHICAGO_%t_%s_%r.log'
target1:
*.DB_NAME=CHICAGO
*.db_unique_name='BOSTON'
*.log_archive_config='DG_CONFIG=(CHICAGO,
BOSTON)'
*.log_archive_dest_1='location=/adjarch/CHICAGO
reopen=60'
*.log_archive_dest_2='SERVICE=CHICAGO
NOAFFIRM ASYNC VALID_FOR=(ONLINE_LOGFILES,PRIMARY_ROLE)
DB_UNIQUE_NAME=CHICAGO'
Target2:
*.DB_NAME=????
*.db_unique_name='TORONTO'
*.log_archive_config='DG_CONFIG=(CHICAGO,TORONTO)'
*.log_archive_dest_1='location=/adjarch/CHICAGO
reopen=60'
*.log_archive_dest_3='SERVICE=CHICAGO
NOAFFIRM ASYNC VALID_FOR=(ONLINE_LOGFILES,PRIMARY_ROLE)
DB_UNIQUE_NAME=CHICAGO'
In
this paper, I thought I would provide a few things that you may not
know about SRLs. Some of this information was covered in the previous
article, but it’s good to have all of this in one location. I write
these items in no particular order.
Do
not assign SRLs to a specific thread. – There is a temptation
for DBAs who work on Oracle RAC databases to assign a SRL to a
specific thread of redo. The RAC DBA is already familiar with
creating Online Redo Logs (ORLs) for a specific thread, one for each
instance in the RAC database. So they must do similarly for SRLs,
correct? The answer is no. Do not assign SRLs to a specific thread.
If the SRL is assigned to a specific thread, then it can only be used
by that thread and no other. If the SRL is not assigned to a thread,
it can be used by any thread.
SRLs
do not rotate like ORLs. – Most DBAs are used to seeing Online
Redo Logs rotate. If there are three ORL groups, redo will be written
to group 1, then group 2, and then group 3, and then back to group 1
again. Many DBAs working with SRLs for the first time assume SRLs
rotate the same way, but they do not. If you have SRL groups 10, 11,
12, and 13 then the first redo transport stream will be written to
SRL group 10. The next one will be written to SRL group 11. If group
10 becomes available again, the third redo stream will be written to
SRL group 10. It is possible that SRL group 13 never gets used.
You
should have one more SRL groups than ORL groups – If you go
back to the article I linked at the start, there is a second diagram
showing the flow of redo when SRLs are in place. Either MRP0 or ARCn
is reading from the SRL and applying redo or creating an archived
redo log. No matter which route is taken for the redo, the process
can take some time. It is a good idea to have an extra SRL in case
the redo writes from the SRLs take extra time. Remember for
Oracle RAC primary databases, to count the groups from all primary
threads.
SRLs
provide a near-zero data loss solution, even in Max Performance mode.
– As I stated in the previous article, SRLs are great for achieving
a near-zero data loss solution even in Max Performance mode. If you
look at the second diagram in that article, you can see that the
primary will transport redo to the SRL in near real time. You would
use Max Protect mode when you absolutely cannot afford data loss, but
SRLs get you close to near-zero data loss which is often good enough
for most people. Here is a production database (name changed to
protect the innocent) as seen in the DG Broker. We can see the
configuration is Max Performance mode.
DGMGRL>
show configuration
Configuration
- orcl_orcls
Protection
Mode: MaxPerformance
DGMGRL>
show database orcls
Database
- orcls
Role:
PHYSICAL STANDBY
Intended
State: APPLY-ON
Transport
Lag: 0 seconds (computed 0
seconds ago)
Apply
Lag: 4 hours 29
minutes 21 seconds (computed 0 seconds ago)
Average
Apply Rate: 5.02 MByte/s
We
can also see a transport lag of 0 seconds. I typically see between 0
and 2 seconds of transport lag on this system. One might say that
this system does not generate a log of redo, which is why I included
the Average Apply Rate in the output. This standby is applying 5
megabytes per second on average, which means the primary is
generating lots of redo. This is not an idle system and I’m still
seeing a near-zero data loss implementation.
For
RAC standby, any node can receive redo to the SRLs. – If you
have an Oracle RAC primary and an Oracle RAC standby, then any node
in the primary can transport redo to the SRLs on any node in the
standby. This is why I use VIPs for my LOG_ARCHIVE_DEST_2
parameter settings in my configuration. I now have high availability
for my redo transport. You may see SRLs active on any node in your
RAC standby. That being said, in 12.1.0.2 and earlier, only one
node will perform the redo apply.
If
you use an Apply Delay, redo apply won’t take place until the log
switch occurs. – If you look at my output from the DG Broker
above, you’ll see a 0 second transport lag but an apply lag of
almost 4.5 hours. I have set an Apply Delay of 4 hours in this
standby database. Because the redo is written to the SRL, the redo
from that SRL is not available to be applied until the log switch
completes and that log switch passes the same apply delay. In my
primary databases, I often set ARCHIVE_LAG_TARGET to 1 hour so that I
have ORL switches at most once per hour. The apply lag in the standby
will often be between Apply Delay and Apply Delay+ARCHIVE_LAG_TARGET.
With my configuration, my apply lag is often between 4 and 5 hours.
If you use an apply delay, then it’s a good idea to set the
ARCHIVE_LAG_TARGET as well. Too many people miss this point and
assume the apply lag should be very close to the Apply Delay setting.
Redo
Transport does not use ARCn if SRLs are in place. – Too often,
I see a posting in some forum where it is assumed that ARCn is
the only process that transports redo to the standby. If SRLs are in
place, NSAn is used instead, or LNS if prior to 12c. Refer
back to the diagrams in my earlier paper for details on how log
transport works.
SRLs
should be the same size and at least as large as the biggest ORL.
– I try to keep the ORL and SRL groups all set to the same exact
size. But if there are mixed ORL sizes, then make sure the SRLs are
sized to the largest of the ORL groups. Redo transport can be written
to any of the SRLs, so all of the SRLs need to be sized to handle
redo from any ORL.
Architecure
of standby database

Data
Protection Modes
Select the mode to balance cost, availability, performance, and
data protection:
• Maximum protection
• Maximum availability
• Maximum performance
Maximum Protection
This protection mode guarantees that no data loss occurs if the primary database fails. For
this level of protection, the redo data that is needed to recover each transaction must be
written to both the local online redo log and the standby redo log (used to store redo data
received from another database) on at least one standby database before the transaction
commits. To ensure that data loss does not occur, the primary database shuts down if a fault
prevents it from writing its redo stream to at least one remote standby redo log.
Maximum protection mode requirements:
• Configure standby redo log files on at least one standby database database.
• Set the SYNC and AFFIRM attributes of the LOG_ARCHIVE_DEST_n parameter for at
least one standby database destination.
Note: Oracle recommends a minimum of two standby databases for maximum protection
mode
Maximum Availability
TMaximum availability mode ensures zero data loss without compromising the availability of the primary database.
Redo data must be written to both the local online redo log and received by the remote RFS process of a standby database.
The primary database does not shut down if it cannot receive acknowledgement from at least one standby.
The standby must initiate I/O to the standby redo log and send acknowledgement back to the primary.
It does not have to wait on the I/O to complete. This feature is known as FastSync in Oracle Database 12c.
The primary database does not shut down if a fault prevents communicating with a standby instance.
Instead, the primary database operates in an unsynchronized mode until the fault is corrected and all gaps in redo
log files are resolved. When all gaps are resolved and the standby database is synchronized,
primary database automatically resumes operating in maximum availability mode.
This mode guarantees that no data loss occurs if the primary database fails—but only if a
second fault does not prevent a complete set of redo data from being sent from the primary
database to at least one standby database.
Maximum availability mode requirements:
• Configure standby redo log files on at least one standby database.
• Set the SYNC and NOFFIRM attributes of the LOG _ ARCHIVE _ DEST _ n pparameter for at
least one standby database. The SYNC and AFFIRM attributes can also be used.
Maximum Performance (Default)
Maximum performance mode is the default level of data protection.
This mode provides the highest possible level of data protection without affecting the performance of the
primary database.
Transactions can commit as soon as the redo data is written to the local online redo log.
When network links with sufficient bandwidth are used, this mode provides a level of data
protection that approaches that of maximum availability mode with minimal impact on primary
database performance.
Maximum performance mode requirement: Set the ASYNC and NOAFFIRM redo transport
attributes of the LOG_ARCHIVE_DEST_n parameter on at least one standby database.
Setting the Data Protection Mode
by Using SQL
Set the data protection mode on the primary database:
SQL> ALTER DATABASE SET STANDBY DATABASE TO MAXIMIZE AVAILABILITY;
Database Altered.
Confirm that the primary database is operating in the new
protection mode:
SQL> SELECT protection_mode FROM v$database;

why are job running slow on particulart node
How to improve performance of managed recover process

what is oracle wallet
if extract process failed , How to troubleshoo
How to set up maximum protection and maximum availablity database
setup:
    There is a Primary Database in Maximum Protection Mode having at least two associated Standby Databases.
    Both Standby Databases are serving the Maximum Protection Mode, ie. Log Transport Services to these Standby Databases are using 'LGWR SYNC AFFIRM'
    One or both Standby Databases are Physical Standby Databases in Active Data Guard Mode or at least open 'READ ONLY'
Behaviour:
If we now try to shutdown such a Standby Database which is open READ ONLY, if fails with
ORA-01154: database busy. Open, close, mount, and dismount not allowed
although the remaining Standby Databases are serving the Maximum Protection Mode, too.
In the ALERT.LOG we can find Entries like this:
Attempt to shut down Standby Database
Standby Database operating in NO DATA LOSS mode
Detected primary database alive, shutdown primary first, shutdown aborted

Cause
If the Primary Database is in Maximum Protection Mode all associated Standby Databases serving this Protection Mode are considered as 'No Data Loss' Standby Databases and so cannot be shutdown as long as the Primary Database is in this Proctection Mode or still alive.
Solution
If you want to shutdown this Standby Database only, there are two Possibilities:
1. Use 'shutdown abort' which will force the Shutdown the Standby Database. Typically this should not harm the Standby Database; however ensure that Log Apply Services (Managed Recovery) are stopped before you issue this Command. So you can use:

SQL> alter database recover managed standby database cancel;
SQL> shutdown abort
2. Set the State of the corresponding log_archive_dest_n serving this Standby Database to 'defer' on the Primary Database (and perform a Log Switch to make this Change effective), then you can shutdown the Standby Database in any Way after the RFS-Processes terminated on this Standby Database (if they do not terminate in a timely Manner you can also kill those using OS-Kill Command)

On the Primary set the State to 'defer', eg. for log_archive_dest_2
SQL> alter system set log_archive_dest_state_2='defer' scope=memory;
SQL> alter system switch logfile;
Then on the Standby you can can shutdown (eg. shutdown immediate)
SQL> shutdown immediate;

To find out about still alive RFS-Processes and their PID you can use this Query:
SQL> select process, pid, status from v$managed_standby

If you have to kill RFS Processes you can do this using OS Kill-Command:
$ kill -9 <pid>
For both Cases ensure there is at least one surviving Standby Database available still serving the Maximum Protection Mode.
=======================

what will happend evm down and clusterware troubleshoot method
This note gives the output of the 'ps' command on pre 11gR2 releases of Oracle CRS and shows all clusterware processes running. It also helps to diagnose in which state the clusterware stands following the 'ps' outlook. note:1050908.1 explains the same for 11gR2 onwards.
Solution

Introduction
All the clusterware processes are normally retrieved via OS commands like:
ps -ef | grep -E 'init|d.bin|ocls|sleep|evmlogger|oprocd|diskmon|PID'
There are general processes, i.e. processes that need to be started on all platforms/releases
and specific processes, i.e. processes that need to be started on some CRS versions/platforms
a. the general processes are
ocssd.bin
evmd.bin
evmlogger.bin
crsd.bin

b. the specific processes are
oprocd: run on Unix when vendor Clusterware is not running. On Linux, only starting with 10.2.0.4.
oclsvmon.bin: normally run when a third party clusterware is running
oclsomon.bin: check program of the ocssd.bin (starting in 10.2.0.1)
diskmon.bin: new 11.1.0.7 process for exadata
oclskd.bin: new 11.1.0.6 process to reboot nodes in case rdbms instances are hanging
There are three fatal processes, i.e. processes whose abnormal halt or kill will provoque a node reboot (see note:265769.1):
1. the ocssd.bin
2. the oprocd.bin
3. the oclsomon.bin
The other processes are automatically restarted when they go away.
outlook of the 'ps' output
A. When all clusterware processes are started
1. CRS 10.2.0.3 on Solaris without third party clusterware

ps -ef | /usr/xpg4/bin/grep -E 'init|d.bin|ocls|sleep|evmlogger|UID'
     UID   PID  PPID   C    STIME TTY         TIME CMD
    root     1     0   0   Aug 25 ?          43:22 /sbin/init
    root   799     1   1   Aug 25 ?        1447:06 /bin/sh /etc/init.d/init.cssd fatal
    root   797     1   0   Aug 25 ?           0:00 /bin/sh /etc/init.d/init.evmd run
    root   801     1   0   Aug 25 ?           0:00 /bin/sh /etc/init.d/init.crsd run
    root  1144   799   0   Aug 25 ?           0:00 /bin/sh /etc/init.d/init.cssd daemon
    root  1091   799   0   Aug 25 ?           0:00 /bin/sh /etc/init.d/init.cssd oprocd
    root  1107   799   0   Aug 25 ?           0:00 /bin/sh /etc/init.d/init.cssd oclsomon
  oracle  1342  1144   0   Aug 25 ?         687:50 /u01/app/oracle/crs/10.2/bin/ocssd.bin
    root  1252  1091   0   Aug 25 ?          25:45 /u01/app/oracle/crs/10.2/bin/oprocd.bin run -t 1000 -m 10000 -hsi 5:10:50:75:90
  oracle  1265  1107   0   Aug 25 ?           0:00 /bin/sh -c cd /u01/app/oracle/crs/10.2/log/artois1/cssd/oclsomon; ulimit -c unl
  oracle  1266  1265   0   Aug 25 ?         125:34 /u01/app/oracle/crs/10.2/bin/oclsomon.bin
    root 22137   799   0 07:10:38 ?           0:00 /bin/sleep 1
  oracle  1041   797   0   Aug 25 ?          68:01 /u01/app/oracle/crs/10.2/bin/evmd.bin
  oracle  1464  1041   0   Aug 25 ?           2:58 /u01/app/oracle/crs/10.2/bin/evmlogger.bin -o /u01/app/oracle/crs/10.2/evm/log/
    root  1080   801   0   Aug 25 ?        2299:04 /u01/app/oracle/crs/10.2/bin/crsd.bin reboot

2. CRS 10.2.0.3 on HP/UX with HP Serviceguard
ps -ef | /usr/bin/grep -E 'init|d.bin|ocls|sleep|evmlogger|UID'
     UID   PID  PPID  C    STIME TTY       TIME COMMAND
    root     1     0  0  Nov 13  ?        12:58 init
    root 17424     1  0  Dec 17  ?        136:39 /bin/sh /sbin/init.d/init.cssd fatal
    root 17425     1  0  Dec 17  ?         0:00 /bin/sh /sbin/init.d/init.crsd run
    root 17624 17424  0  Dec 17  ?         0:00 /bin/sh /sbin/init.d/init.cssd daemon
   haclu 17821 17624  0  Dec 17  ?        268:13 /haclu/64bit/app/oracle/product/crs102/bin/ocssd.bin
    root 17621 17424  0  Dec 17  ?         0:00 /bin/sh /sbin/init.d/init.cssd oclsvmon
   haclu 17688 17621  0  Dec 17  ?         0:00 /bin/sh -c cd /haclu/64bit/app/oracle/product/crs102/log/cehpclu7/cssd/oclsvmon; ulimit -c unlimited; /haclu/64bit/app/oracle/p
   haclu 17689 17688  0  Dec 17  ?         8:04 /haclu/64bit/app/oracle/product/crs102/bin/oclsvmon.bin
    root 17623 17424  0  Dec 17  ?         0:00 /bin/sh /sbin/init.d/init.cssd oclsomon
   haclu 17744 17623  0  Dec 17  ?         0:00 /bin/sh -c cd /haclu/64bit/app/oracle/product/crs102/log/cehpclu7/cssd/oclsomon; ulimit -c unlimited; /haclu/64bit/app/oracle/p
   haclu 17750 17744  0  Dec 17  ?        158:34 /haclu/64bit/app/oracle/product/crs102/bin/oclsomon.bin
    root 11530 17424  1 14:13:28 ?         0:00 /bin/sleep 1
   haclu  5727     1  0 13:49:56 ?         0:00 /haclu/64bit/app/oracle/product/crs102/bin/evmd.bin
   haclu  5896  5727  0 13:49:59 ?         0:00 /haclu/64bit/app/oracle/product/crs102/bin/evmlogger.bin -o /haclu/64bit/app/oracle/product/crs102/evm/log/evmlogger.info -l /h
    root 17611 17425  0  Dec 17  ?        163:50 /haclu/64bit/app/oracle/product/crs102/bin/crsd.bin reboot

3. CRS 10.2.0.4 on AIX with HACMP installed
# ps -ef | grep -E 'init|d.bin|ocls|sleep|evmlogger|UID'
     UID    PID   PPID   C    STIME    TTY  TIME CMD
    root      1      0   0   Dec 23      -  0:56 /etc/init
    root 106718      1   0   Jan 05      - 25:01 /bin/sh /etc/init.cssd fatal
    root 213226      1   0   Jan 05      -  0:00 /bin/sh /etc/init.crsd run
    root 278718      1   0   Jan 05      -  0:00 /bin/sh /etc/init.evmd run
    root 258308 106718   0   Jan 05      -  0:00 /bin/sh /etc/init.cssd daemon
   haclu 299010 348438   0   Jan 05      - 12:24 /haclu/64bit/app/oracle/product/crs102/bin/ocssd.bin
    root 315604 106718   0   Jan 05      -  0:00 /bin/sh /etc/init.cssd oclsomon
   haclu 303300 315604   0   Jan 05      -  0:00 /bin/sh -c cd /haclu/64bit/app/oracle/product/crs102/log/celaixclu3/cssd/oclsomon; ulimit -c unlimited; /haclu/64bit/app/oracle/product/crs102/bin/oclsomon  || exit $?
   haclu 278978 303300   0   Jan 05      -  2:36 /haclu/64bit/app/oracle/product/crs102/bin/oclsomon.bin
    root 250352 106718   0 13:56:56      -  0:00 /bin/sleep 1
   haclu 323672 278718   0   Jan 05      -  0:58 /haclu/64bit/app/oracle/product/crs102/bin/evmd.bin
   haclu 311416 323672   0   Jan 05      -  0:01 /haclu/64bit/app/oracle/product/crs102/bin/evmlogger.bin -o /haclu/64bit/app/oracle/product/crs102/evm/log/evmlogger.info -l /haclu/64bit/app/oracle/product/crs102/evm/log/evmlogger.log
    root 287166 213226   2   Jan 05      - 84:56 /haclu/64bit/app/oracle/product/crs102/bin/crsd.bin reboot

4. CRS 11.1.0.7 on Linux 32bit
[root@haclulnx1 init.d]# ps -ef | grep -E 'init|d.bin|ocls|oprocd|diskmon|evmlogger|PID'
UID        PID  PPID  C STIME TTY          TIME CMD
root         1     0  0 16:55 ?        00:00:00 init [5]
root      5412     1  0 16:56 ?        00:00:00 /bin/sh /etc/init.d/init.evmd run
root      5413     1  0 16:56 ?        00:00:03 /bin/sh /etc/init.d/init.cssd fatal
root      5416     1  0 16:56 ?        00:00:00 /bin/sh /etc/init.d/init.crsd run
root      7690  5413  0 16:56 ?        00:00:00 /bin/sh /etc/init.d/init.cssd daemon
oracle    8465  7690  0 16:57 ?        00:00:01 /orasoft/red4u2/crs/bin/ocssd.bin
root      7648  5413  0 16:56 ?        00:00:00 /bin/sh /etc/init.d/init.cssd oprocd
root      8372  7648  0 16:56 ?        00:00:00 /orasoft/red4u2/crs/bin/oprocd run -t 1000 -m 500 -f
root      7672  5413  0 16:56 ?        00:00:00 /bin/sh /etc/init.d/init.cssd diskmon
oracle    8255  7672  0 16:56 ?        00:00:00 /orasoft/red4u2/crs/bin/diskmon.bin -d -f
root      7658  5413  0 16:56 ?        00:00:00 /bin/sh /etc/init.d/init.cssd oclsomon
root      8384  7658  0 16:56 ?        00:00:00 /sbin/runuser -l oracle -c /bin/sh -c 'cd /orasoft/red4u2/crs/log/haclulnx1/cssd/oclsomon; ulimit -c unlimited; /orasoft/red4u2/crs/bin/oclsomon  || exit $?'
oracle    8385  8384  0 16:56 ?        00:00:00 /bin/sh -c cd /orasoft/red4u2/crs/log/haclulnx1/cssd/oclsomon; ulimit -c unlimited; /orasoft/red4u2/crs/bin/oclsomon  || exit $?
oracle    8418  8385  0 16:56 ?        00:00:01 /orasoft/red4u2/crs/bin/oclsomon.bin
root      9746     1  0 17:00 ?        00:00:00 /orasoft/red4u2/crs/bin/oclskd.bin
oracle   10537     1  0 17:01 ?        00:00:00 /orasoft/red4u2/crs/bin/oclskd.bin
oracle    7606  7605  0 16:56 ?        00:00:00 /orasoft/red4u2/crs/bin/evmd.bin
oracle    9809  7606  0 17:00 ?        00:00:00 /orasoft/red4u2/crs/bin/evmlogger.bin -o /orasoft/red4u2/crs/evm/log/evmlogger.info -l /orasoft/red4u2/crs/evm/log/evmlogger.log
root      7585  5416  0 16:56 ?        00:00:08 /orasoft/red4u2/crs/bin/crsd.bin reboot

B. When the clusterware is not allowed to start on boot

This state is reached when:
1. 'crsctl stop crs' has been issued and the clusterware is stopped
or
2. the automatic startup of the clusterware has been disabled and the node has been rebooted, e.g.
./init.crs disable
Automatic startup disabled for system boot.

The 'ps' command only show the three inittab processes with spawned sleeping processes in a 30seconds loop
ps -ef | grep -E 'init|d.bin|ocls|oprocd|diskmon|evmlogger|sleep|PID'
UID        PID  PPID  C STIME TTY          TIME CMD
root         1     0  0 16:55 ?        00:00:00 init [5]
root     19770     1  0 18:00 ?        00:00:00 /bin/sh /etc/init.d/init.evmd run
root     19854     1  0 18:00 ?        00:00:00 /bin/sh /etc/init.d/init.crsd run
root     19906     1  0 18:00 ?        00:00:00 /bin/sh /etc/init.d/init.cssd fatal
root     22143 19770  0 18:02 ?        00:00:00 /bin/sleep 30
root     22255 19854  0 18:02 ?        00:00:00 /bin/sleep 30
root     22266 19906  0 18:02 ?        00:00:00 /bin/sleep 30

The clusterware can be reenabled via './init.crs enable' execution or/and via 'crsctl start crs'

C. When the clusterware is allowed to start on boot, but can't start because some prerequisites are not met

This state is reached when the node has reboot and some prerequisites are missing, e.g.
1. OCR is not accessible
2. cluster interconnect can't accept tcp connections
3. CRS_HOME is not mounted
...
and 'crsctl check boot' (run as oracle) show errors, e.g.
$ crsctl check boot
Oracle Cluster Registry initialization failed accessing Oracle Cluster Registry device:
PROC-26: Error while accessing the physical storage Operating System error [No such file or directory] [2]
The three inittab processes are sleeping for 60seconds in a loop in 'init.cssd startcheck'
ps -ef | grep -E 'init|d.bin|ocls|oprocd|diskmon|evmlogger|sleep|PID'
UID        PID  PPID  C STIME TTY          TIME CMD
root         1     0  0 18:28 ?        00:00:00 init [5]
root      4969     1  0 18:29 ?        00:00:00 /bin/sh /etc/init.d/init.evmd run
root      5060     1  0 18:29 ?        00:00:00 /bin/sh /etc/init.d/init.cssd fatal
root      5064     1  0 18:29 ?        00:00:00 /bin/sh /etc/init.d/init.crsd run
root      5405  4969  0 18:29 ?        00:00:00 /bin/sh /etc/init.d/init.cssd startcheck
root      5719  5060  0 18:29 ?        00:00:00 /bin/sh /etc/init.d/init.cssd startcheck
root      5819  5064  0 18:29 ?        00:00:00 /bin/sh /etc/init.d/init.cssd startcheck
root      6986  5405  0 18:30 ?        00:00:00 /bin/sleep 60
root      6987  5819  0 18:30 ?        00:00:00 /bin/sleep 60
root      7025  5719  0 18:30 ?        00:00:00 /bin/sleep 60

Once the 'crsctl check boot' will return nothing (no error messages anymore), then the clusterware processes will start.
Oracle Rac crsctl and srvctl commands
CRSCTL
Commands :-
Cluster
Related Commands
|
|
| crs_stat t | Shows HA resource status (hard to read) |
| crsstat | Output of crs_stat t formatted nicely |
| crsctl check crs | CSS,CRS,EVM appears healthy |
| crsctl stop crs | Stop crs and all other services |
| crsctl disable crs | Prevents CRS from starting on reboot |
| crsctl enable crs | Enables CRS start on reboot |
| crs_stop all | Stops all registered resources |
| crs_start all | Starts all registered resources |
| crsctl stop cluster -all | Stops the cluster in all nodes |
| crsctl start cluster -all | Starts the cluster in all nodes |
SRVCTL
Commands :-
Database
Related Commands
|
|
| srvctl start instance -d <db_name> -i <inst_name> | Starts an instance |
| srvctl start database -d <db_name> | Starts all instances |
| srvctl stop database -d <db_name> | Stops all instances, closes database |
| srvctl stop instance -d <db_name> -i <inst_name> | Stops an instance |
| srvctl start service -d <db_name> -s <service_name> | Starts a service |
| srvctl stop service -d <db_name> -s <service_name> | Stops a service |
| srvctl status service -d <db_name> | Checks status of a service |
| srvctl status instance -d <db_name> -i <inst_name> | Checks an individual instance |
| srvctl status database -d <db_name> | Checks status of all instances |
| srvctl start nodeapps -n <node_name> | Starts gsd, vip, listener, and ons |
| srvctl stop nodeapps -n <node_name> | Stops gsd, vip and listener |
| srvctl status scan | Status of scan listener |
| srvctl config scan | Configuration of scan listener |
| srvctl status asm | Status of ASM instance |
  How to interpret explain plan and what is cost in explain planThis cost is a number that represents the estimated resource usage for each step.It is just a number or an internal unit that is used to be able to compare different plans.

Estimating
The estimator generates three types of measures:
• Selectivity y
• Cardinality
. Cost
Cardinality represents the number of rows in a row source.
Cost represents the units of work or resource that are used.
Cardinality represents the number of rows in a row source.Here, the row source can be base table , a view or
the result of a join or group by operator. If a select from a table is performed . the table is the row source and the cardinality is the number of rows in that table.
 A higher cardinality => you're going to fetch more rows => you're
going to do more work => the query will take longer. Thus the cost is
 (usually) higher.
A higher cardinality => you're going to fetch more rows => you're
going to do more work => the query will take longer. Thus the cost is
 (usually) higher.

All other things being equal, a query with a
higher cost will use more resources and thus take longer to run. But all
 things rarely are equal. A lower cost query can run faster than a
higher cost one!
 Cost represents the number of units of work (or resource) that are used. The query optimizer
uses disk I/O, CPU usage, and memory usage as units of work. So the cost used by the query
optimizer represents an estimate of the number of disk I/Os and the amount of CPU and
memory used in performing an operation. The operation can be scanning a table, accessing
rows from a table by using an index, joining two tables together, or sorting a row source.
query is executed and its result is produced.  The COST is the final output of the Cost-based optimiser (CBO),
The access path determines the number of units of work that are required to get data from a
base table. The access path can be a table scan, a fast full index scan, or an index scan.

Changing optimizer behavior

The optimizer is influenced by:
• SQL statement construction
• Data structure
• Statistics
• SQL Plan Management options
• Session parameters
• System parameters
• Hints


Adaptive Execution Plans
A query plan changes during execution because runtime conditions indicate that optimizer estimates are inaccurate.
All adaptive execution plans rely on statistics that are collected during query execution.
The two adaptive plan techniques are:
– Dynamic plans  -- A dynamic plan chooses among subplans during statement execution.
For dynamic plans, the optimizer must decide which subplans to include in a dynamic
plan, which statistics to collect to choose a subplan, and thresholds for this choice.
– Re-optimization -- In contrast, re-optimization changes a plan for executions after the
current execution. For re-optimization, the optimizer must decide which statistics to
collect at which points in a plan and when re-optimation is feasible
Operations that Retrieve Rows (Access Paths)
As
I mentioned earlier, some operations retrieve rows from data sources,
and in those cases, the object_name column shows the name of the data
source, which can be a table, a view, etc. However, the optimizer
might choose to use different techniques to retrieve the data
depending on the information it has available from the database
statistics. These different techniques that can be used to retrieve
data are usually called access paths, and they are displayed in the
operations column of the plan, usually enclosed in parenthesis.
Below
is a list of the most common access paths with a small explanation of
them (source).
I will not cover them all because I don’t want to bore you .
I’m sure that after reading the ones I include here you will have a
very good understanding of what access paths are and how they can
affect the performance of you queries.
Full Table Scan
A
full table scan reads all rows from a table, and then filters out
those rows that do not meet the selection criteria (if there is one).
Contrary to what one could think, full table scans are not
necessarily a bad thing. There are situations where a full table scan
would be more efficient than retrieving the data using an index.
Table Access by Rowid
A
rowid is an internal representation of the storage location of data.
The rowid of a row specifies the data file and data block containing
the row and the location of the row in that block. Locating a row by
specifying its rowid is the fastest way to retrieve a single row
because it specifies the exact location of the row in the database.
In
most cases, the database accesses a table by rowid after a scan of
one or more indexes.
Index Unique Scan
An
index unique scan returns at most 1 rowid, and thus, after an index
unique scan you will typically see a table access by rowid (if the
desired data is not available in the index). Index unique scans can
be used when a query predicate references all of the columns of a
unique index, by using the equality operator.
Index Range Scan
An
index range scan is an ordered scan of values, and it is typically
used when a query predicate references some of the leading columns of
an index, or when for any reason more than one value can be retrieved
by using an index key. These predicates can include equality and
non-equality operators (=, <. >, etc).
Index Full Scan
An
index full scan reads the entire index in order, and can be used in
several situations, including cases in which there is no predicate,
but certain conditions would allow the index to be used to avoid a
separate sorting operation.
Index Fast Full Scan
An
index fast full scan reads the index blocks in unsorted order, as
they exist on disk. This method is used when all of the columns the
query needs to retrieve are in the index, so the optimizer uses the
index instead of the table.
Index Join Scan
An
index join scan is a hash join of multiple indexes that together
return all columns requested by a query. The database does not need
to access the table because all data is retrieved from the indexes.
Operations that Manipulate Data
As
I mentioned before, besides the operations that retrieve data from
the database, there are some other types of operations you may see in
an execution plan, which do not retrieve data, but operate on data
that was retrieved by some other operation. The most common
operations in this group are sorts and joins.
Sorts
A
sort operation is performed when the rows coming out of the step need
to be returned in some specific order. This can be necessary to
comply with the order requested by the query, or to return the rows
in the order in which the next operation needs them to work as
expected, for example, when the next operation is a sort merge join.
Joins
When
you run a query that includes more than one table in the FROM clause
the database needs to perform a join operation, and the job of the
optimizer is to determine the order in which the data sources should
be joined, and the best join method to use in order to produce the
desired results in the most efficient way possible.
Both
of these decisions are made based on the available statistics.
Here
is a small explanation for the different join methods the optimizer
can decide to use:
Nested Loops Joins
When
this method is used, for each row in the first data set that matches
the single-table predicates, the database retrieves all rows in the
second data set that satisfy the join predicate. As the name implies,
this method works as if you had 2 nested for loops in a procedural
programming language, in which for each iteration of the outer loop
the inner loop is traversed to find the rows that satisfy the join
condition.
As
you can imagine, this join method is not very efficient on large data
sets, unless the rows in the inner data set can be accessed
efficiently (through an index).
In
general, nested loops joins work best on small tables with indexes on
the join conditions.
Hash Joins
The
database uses a hash join to join larger data sets. In summary, the
optimizer creates a hash table (what
is a hash table?) from one of the data sets (usually the smallest
one) using the columns used in the join condition as the key, and
then scans the other data set applying the same hash function to the
columns in the join condition to see if it can find a matching row in
the hash table built from the first data set.
You
don’t really need to understand how a hash table works. In general,
what you need to know is that this join method can be used when you
have an equi-join, and that it can be very efficient when the smaller
of the data sets can be put completely in memory.
On
larger data sets, this join method can be much more efficient than a
nested loop.
Sort Merge Joins
A
sort merge join is a variation of a nested loops join. The main
difference is that this method requires the 2 data sources to be
ordered first, but the algorithm to find the matching rows is more
efficient.
This
method is usually selected when joining large amounts of data when
the join uses an inequality condition, or when a hash join would not
be able to put the hash table for one of the data sets completely in
memory.
 what is Incremental statistics
Incremental statistics maintenance was introduced in Oracle Database 11g to improve the performance of gathering statistics on large partitioned table. When incremental statistics maintenance is enabled for a partitioned table, Oracle accurately generated global level  statistics by aggregating partition level statistics.
By default, incremental maintenance does not use the staleness status to decide when to update statistics. This scenario is covered in an earlier blog post for Oracle Database 11g. If a partition or sub-partition is subject to even a single DML operation, statistics will be re-gathered, the appropriate synopsis will be updated and the global-level statistics will be re-calculated from the synopses. This behavior can be changed in Oracle Database 12c, allowing you to use the staleness threshold to define when incremental statistics will be re-calculated. This is covered in Staleness and DML thresholds, below.
Implementation
Enabling synopses
To enable the creation of synopses, a table must be configured to use incremental maintenance. This feature is switched on using a DBMS_STATS preference called ‘INCREMENTAL’. For example:
EXEC dbms_stats.set_table_prefs(null,'SALES','INCREMENTAL','TRUE')
Checking that incremental maintenance is enabled
The value of the DBMS_STATS preference can be checked as follows:
SELECT dbms_stats.get_prefs(pname=>'INCREMENTAL',
                            tabname=>'SALES')
FROM dual;
Staleness and DML thresholds
As mentioned above, Optimizer statistics are considered stale when the number of changes made to data exceeds a certain threshold. This threshold is expressed as a percentage of row changes for a table, partition or subpartition and is set using a DBMS_STATS preference called STALE_PERCENT. The default value for stale percent is 10 so, for example, a partition containing 100 rows would be marked stale if more than 10 rows are updated, added or deleted. Here is an example of setting and inspecting the preference:

EXEC dbms_stats.set_table_prefs(null, 'SALES', 'STALE_PERCENT','5')
select dbms_stats.get_prefs('STALE_PERCENT',null,'SALES') from dual;

It is easy to check if a table or partition has been marked as stale:
select partition_name,
       subpartition_name,
       stale_stats               /* YES or NO */
from   dba_tab_statistics where  table_name = 'SALES';
The database tracks DML operations to measure when data change has caused a table to exceed its staleness threshold. If you want to take a look at this information, bear in mind that the statistics are approximate and they are autmatically flushed to disk periodically. If you want to see the figures change immediately during your tests then you will need to flush them manually (you must have ‘ANALYZE ANY’ system privilege), like this:
EXEC dbms_stats.flush_database_monitoring_info
select  * from    dba_tab_modifications
where   table_name = 'SALES';
Remember that if you are using incremental statistics in Oracle Database 11g, a single DML operation on a partition or sub-partition will make it a target for a statistics refresh  - even if it is not marked stale. In other words, we might update one row in a partition containing 1 million rows. The partition won't be marked state (if we assume a 10% staleness threshold) but fresh statistics will be gathered. Oracle Database 12c exhibits the same behavior by default, but this release gives you the option to allow multiple DML changes to occur against a partition or sub-partition before it is a target for incremental refresh. You can enable this behavior by changing the DBMS_STATS preference INCREMENTAL_STALENESS from its default value (NULL) to 'USE_STALE_PERCENT'. For example:
exec dbms_stats.set_global_prefs('INCREMENTAL_STALENESS', 'USE_STALE_PERCENT')
Once this preference is set, a table’s STALE_PERCENT value will be used to define the threshold of DML change in the context of incremental maintenance. In other words, statistics will not be re-gathered for a partition if the number of DML changes is below the STALE_PERCENT threshold.
Locking statistics

Incremental statistics does work with locked partitions statistics as long as no DML occurs on the locked partitions. However, if DML does occurs on the locked partitions then we can no longer guarantee that the global statistics built from the locked statistics will be accurate so the database will fall back to using the non-incremental approach when gathering global statistics. However, if for some reason you must lock the partition level statistics and still want to take advantage of incremental statistics gathering, you can set the 'INCREMENTAL_STALENESS' preference to include ‘USE_LOCKED_STATS’. Once set, the locked partitions/subpartitions stats are NOT considered as stale as long as they have synopses, regardless of DML changes.
Note that ‘INCREMENTAL_STALENESS’ accepts multiple values, such as:
BEGIN
   dbms_stats.set_table_prefs(
      ownname=>null,
      tabname=>'SALES',
      pname =>'INCREMENTAL_STALENESS',
      pvalue=>'USE_STALE_PERCENT, USE_LOCKED_STATS');
END;
/
Checking for staleness
You can check for table/partition/subpartition staleness very easily using the statistics views. For example:
EXEC dbms_stats.flush_database_monitoring_info
select partition_name,subpartition_name,stale_stats
from   dba_tab_statistics
where  table_name = 'SALES'
order by partition_position, subpartition_position;

Database monitoring information is used identify stale statistics, so you’ll need to call FLUSH_DATABASE_MONITORING_INFO if you’re testing this out and you want to see immediately how the staleness status is affected by data change.
Gathering statistics
How do you gather statistics on a table using incremental maintenance? Keep things simple! Let the Oracle Database work out how best to do it. Use these procedures:

                       EXEC dbms_stats.gather_table_stats(null,'SALES')
or                     EXEC dbms_stats.gather_schema_stats(…)
or, even better        EXEC dbms_stats.gather_database_stats()

For the DBMS_STATS.GATHER... procedures you must use ESTIMATE_PERCENT set to AUTO_SAMPLE_SIZE. Since this is the default, then that is what will be used in the examples above unless you have overriden it. If you use a percentage value for ESTIMATE_PERCENT, incremental maintenance will not kick in.
Regathering statistics when data hasn’t changed
From time-to-time you might notice that statistics are gathered on partitions that have not been subject to any DML changes. Why is this? There are a number of reasons:

    Statistics have been unlocked.
    Table column usage has changed (this is explained below).
    New columns are added. This includes hidden columns created from statistics extensions such as column groups, column expressions.
    Synopses are not in sync with the column statistics. It is possible that you have gathered statistics in incremental mode at time T1. Then you disable incremental and regather statistics at time T2. Then the synopses’ timestamp T1 is out of sync with the basic column statistics’ timestamp T2.
    Unusual cases such as column statistics have been deleted using delete_column_statistics.

Bullet point "2" has some implications. The database tracks how columns are used in query predicates and stores this information in the data dictionary (sys.col_usage$). It uses this information to help it figure out which columns will benefit from a histogram to improve query cardinality estimates and, as a result, improve SQL execution plans. If column usage changes, then the database might choose to re-gather statistics and create a new histogram.
Locally partitioned index statistics

For locally partitioned index statistics, we first check their corresponding table partitions (or subpartitions). If the table (sub)partitions have fresh statistics and the index statistics have been gathered after the table (sub)partition-level statistics, then they are considered fresh and their statistics are not regathered.
Composite partitioned tables

Statistics at the subpartition level are gathered and stored by the database, but note that synopses are created at the partition level only. This means that if the statistics for a subpartition become stale due to data changes, then the statistics (and synopsis) for the parent partition will be refreshed by examining all of its subpartitions. The database only regathers subpartition-level statistics on subpartitions that are stale.

What's difference between SQL profiles and SQL plan baselines.

SQL Profiles were designed to correct Optimizer behavior when underlying data do not fit anymore into its statistical. Their goal is to create the absolute best execution plan for the SQL by giving the very precise data to the optimizer.a SQL profile helps the optimizer minimize mistakes and thus more likely to select the best plan.Sql profile is correction to stattistic that help optimizer to generate more efficient execution Plan.
select name,type,status,sql_text from dba_sql_profiles.
you can also disable the profile if sql is working properly after accepting the profile
COLUMN category FORMAT a10
COLUMN sql_text FORMAT a20

SELECT NAME, SQL_TEXT, CATEGORY, STATUS FROM   DBA_SQL_PROFILES;

BEGIN
  DBMS_SQLTUNE.DROP_SQL_PROFILE (
    name => 'my_sql_profile'
);
END;
/
. Change SQL PROFILE
a. To disable a SQL profile:
exec dbms_sqltune.alter_sql_profile('', 'STATUS', 'DISABLED');

b. To add description to a SQL profile:
exec DBMS_SQLTUNE.alter_sql_profile('sqlprofile_name','DESCRIPTION','this is a test sql profile');

10. To delete SQL Profile:
exec dbms_sqltune.drop_sql_profile('SYS_SQLPROF_0132f8432cbc0000');
A SQL plan baseline for a SQL statement consists of a set of accepted plans. When the statement is parsed, the optimizer will only select the best plan from among this set. If a different plan is found using the normal cost-based selection process, the optimizer will add it to the plan history but this plan will not be used until it is verified to perform better than the existing accepted plan and is evolved.
In Oracle a SQL Profile creates extra information about a particular SQL that the optimizer can use at run time to select the optimal plan to ensure best performance. In essence the SQL Profile enables dynamic behavior where the optimizer has multiple plans to choose from at run time based on run time bind variables etc. When you run the SQL Tuning Advisor for the list of recommendation you will see that the recommendation specifies whether a SQL can be improved by creating a SQL Profile or SQL Baseline. It is preferable to choose a SQL Profile simply because it allows the optimizer to pick best execution plans at run time.
SQL Baseline on the other hand is more of a brute force method, when you simply marry a particular SQL to stay with a specific SQL execution plan. So no matter what the run time bind variables are for a given SQL, the optimizer will always try to use the SQL Baseline plan. This may work fine for most cases but instances where data skew is high it is preferable that one pick more efficient plans based on bind variable values passed at run time instead of always picking the same plan as generated by the SQL Baseline.
SQL query to get SPM baseline.
SQL> select count(*) from dba_sql_plan_baselines where parsing_schema_name='$1';1.
Baselines know what plan they are trying recreate and SQL Profiles do not.
SQL Profiles will blindly apply any hints it has and what you get is what you get.
Baselines will apply the hints and if the optimizer gets the plan it was expecting, it uses the plan.
If it doesn’t come up with the expected plan, the hints are thrown away and the optimizer tries again (possibly with the hints from another accepted Baseline).

2.
Profiles have a “force matching” capability that allows them to be applied to multiple statements that differ only in the values of literals.
Think of it as a just in time cursor sharing feature. Baselines do not have this ability to act on multiple statements.
Comments from Kerry Osborne January 25th, 2012 – 16:38
I have seen Baselines be disregarded, even without such extreme conditions as a specified index having been removed.
The reason for this is that Baselines attempt to apply enough hints to limit the choices the optimizer has to a single plan,
but there are situations where the set of hints is not sufficient to actually force the desired plan.
What I mean is that the hints will eliminate virtually all possibility but there still may be a few that are valid and so it’s possible to get a different plan
In fact, I have even seen situations where the act of creating a Baseline causes the plan to change.
SQL> select empno,ename,job from emp t1 where deptno = 10;

     EMPNO ENAME      JOB
---------- ---------- ---------
      7782 CLARK      MANAGER
      7839 KING       PRESIDENT
      7934 MILLER     CLERK

SQL_ID    55utxfrbncds3, child number 0
-------------------------------------
select empno,ename,job from emp t1 where deptno = 10

Plan hash value: 1614352715

------------------------------------------------------------------------------------------------
| Id  | Operation                                | Name     | Rows  | Bytes | Cost (%CPU)| Time     |
------------------------------------------------------------------------------------------------
|   0 | SELECT STATEMENT                         |          |       |       |     2 (100)|          |
|   1 |  TABLE ACCESS BY INDEX ROWID BATCHED     | EMP      |     3 |    63 |     2   (0)| 00:00:01 |
|*  2 |   INDEX RANGE SCAN                       | DEPT_EMP |     3 |       |     1   (0)| 00:00:01 |
------------------------------------------------------------------------------------------------

Predicate Information (identified by operation id):
---------------------------------------------------

   2 - access("DEPTNO"=10)

Note
-----
   - SQL plan baseline SQL_PLAN_g9mzurk4v9bjw9da07b3a used for this statement
We can also query the Baseline to gather Information about the stored query.
select sql_handle,sql_text,origin,enabled,accepted,adaptive
  from dba_sql_plan_baselines
 where plan_name = 'SQL_PLAN_g9mzurk4v9bjw9da07b3a';

SQL_HANDLE            SQL_TEXT                    ORIGIN        ENABLED ACCEPTED ADAPTIVE
--------------------- --------------------------- ------------- ------- -------- --------
SQL_f4cffabc89b4ae3c  select empno,ename,job      AUTO-CAPTURE  YES     YES      NO
                      from emp where deptno = 10